
DevOps course · lesson 23 of 24
- 1What Is DevOps?
- 2A Language and a Service to Operate
- 3Linux and the Terminal
- 4Bash Scripting for Ops
- 5Git and Collaboration
- 6Networking for DevOps
- 7Web Servers, Proxies and Load Balancers
- 8Docker for DevOps
- 9Docker Compose and Multi-Service Apps
- 10Cloud Providers: AWS, Azure and Google Cloud
- 11Serverless Functions and Platforms
- 12Terraform and Infrastructure as Code
- 13Ansible and Configuration Management
- 14Continuous Integration with GitHub Actions and GitLab CI
- 15Continuous Delivery and Deployment Strategies
- 16Secret Management
- 17Kubernetes Basics
- 18Kubernetes in Practice
- 19GitOps with Argo CD and Flux
- 20Service Mesh: Istio, Linkerd, Consul and Envoy
- 21Metrics and Alerting with Prometheus and Grafana
- 22Logs and Tracing with Loki, Elastic and OpenTelemetry
- 23Reliability, SLOs and Cloud Design Patterns
- 24Capstone: Pebble to Production
After this lesson, you will be able to define service level indicators and objectives for a real service, turn an objective into an error budget and an error budget policy, write burn-rate alerts that page for fast outages and open tickets for slow ones, run an incident with clear roles and a runbook, write a blameless postmortem, set recovery point and recovery time objectives and prove them with a scripted restore drill, and choose cloud design patterns for availability, data, design and operations. You will leave with five templates: an SLO sheet, a runbook, a postmortem, a change checklist and a disaster recovery plan.
Over the last few lessons Pebble gained probes, dashboards, logs and alerts in Metrics and Alerting with Prometheus and Grafana and Logs and Tracing with Loki, Elastic and OpenTelemetry. That tells the team what is happening. It does not tell them what is good enough. Should a five-minute outage wake someone at 3 a.m.? Is it safe to ship a risky change this week? Did last month's backups actually work? Site reliability engineering, introduced in What Is DevOps?, answers these questions with numbers agreed in advance rather than arguments during an incident.
Reliability is a target, not "as high as possible"
Users do not notice the difference between 99.99% and 100% availability, because their own phone, Wi-Fi and internet connection fail more often than that. Chasing perfection costs a great deal: more redundancy, slower releases and engineers who never ship features. Google's SRE book argues that 100% is the wrong target for almost any service. The useful question is how reliable this particular service needs to be for the people who use it, and the answer is written down in three related terms.
| Term | Meaning | Pebble example |
|---|---|---|
| SLI, service level indicator | A measurement of some aspect of the service as users experience it, usually a ratio of good events to all events | The fraction of readiness probes that succeed; later, the fraction of redirect requests answered with a correct 302 within 300 ms |
| SLO, service level objective | A target for an SLI over a time window | 99.5% of readiness probes succeed over a rolling 30 days |
| SLA, service level agreement | A contract with consequences, such as refunds, if an objective is missed | Pebble has none; it is a free fictional service |
Choose SLIs from the user's point of view. "CPU below 80%" is not an SLI, because users do not experience CPU. "Short links redirect successfully and quickly" is. Start with a few: availability, latency for the main request path and, where it matters, correctness or freshness. Pebble's only user-facing signal today is the external readiness probe from the metrics lesson and the uptime checker from Serverless Functions and Platforms, so its first SLI uses probe results. When Pebble exposes request metrics, a request-based SLI that counts real redirects is better, because a probe every 15 seconds can miss short or partial failures.
Set the SLO slightly below what the service already achieves and below what users need, then tighten it only with evidence. An SLA, if you ever have one, should be looser than the SLO, so the team gets warned internally before the contract is broken.
Error budgets turn a target into a decision tool
If the SLO is 99.5% over 30 days, then 0.5% of probes are allowed to fail. That allowance is the error budget. In time, it is:
So Pebble can be unavailable for about three and a half hours in a 30-day window and still meet its objective. The budget is not a target to spend. It is the team's shared measure of how much risk it can take. While budget remains, the team ships features and experiments. When it is spent, reliability work comes first.
Write that down as an error budget policy before you need it. Google's SRE workbook includes an example policy: if the service exceeds its error budget over the preceding four weeks, the team halts changes and releases, except urgent fixes and security fixes, until the service is back within its SLO; and if a single incident consumes more than 20% of the budget, the team holds a postmortem with at least one top-priority action item. Pebble's two-person team adopts a lighter version:
- Budget more than 50% used: new risky changes need a second reviewer and a rollback plan.
- Budget fully used: only fixes and reliability work ship until the 30-day availability is back above 99.5%.
- Any single incident that uses more than 20% of the budget gets a postmortem.
The point of a written policy is that the decision is made calmly and in advance, not by whoever argues loudest after an outage.
Alert on burn rate, not on every failure
An alert that fires on every failed probe pages people for blips nobody noticed. An alert that fires only when the monthly budget is gone tells them far too late. Burn rate measures how fast the budget is being used: a burn rate of 1 uses exactly the whole budget over the 30-day window; a burn rate of 10 would use it in three days.
Google's SRE workbook recommends combining several windows, each pairing a long window that shows the budget really is being consumed with a short window that shows the problem is still happening. For a 30-day objective, its recommended starting points are:
| Severity | Long window | Short window | Burn rate | Budget used when it fires |
|---|---|---|---|---|
| Page | 1 hour | 5 minutes | 14.4 | 2% |
| Page | 6 hours | 30 minutes | 6 | 5% |
| Ticket | 3 days | 6 hours | 1 | 10% |
The last column follows from the formula: budget used equals burn rate times window length divided by the SLO period. For the first row, that is 14.4 × 1 hour ÷ 720 hours, which is 2%. A sharp outage pages within minutes; a slow leak becomes a ticket for working hours; a two-minute blip does neither. The short window also makes alerts stop soon after the problem is fixed.
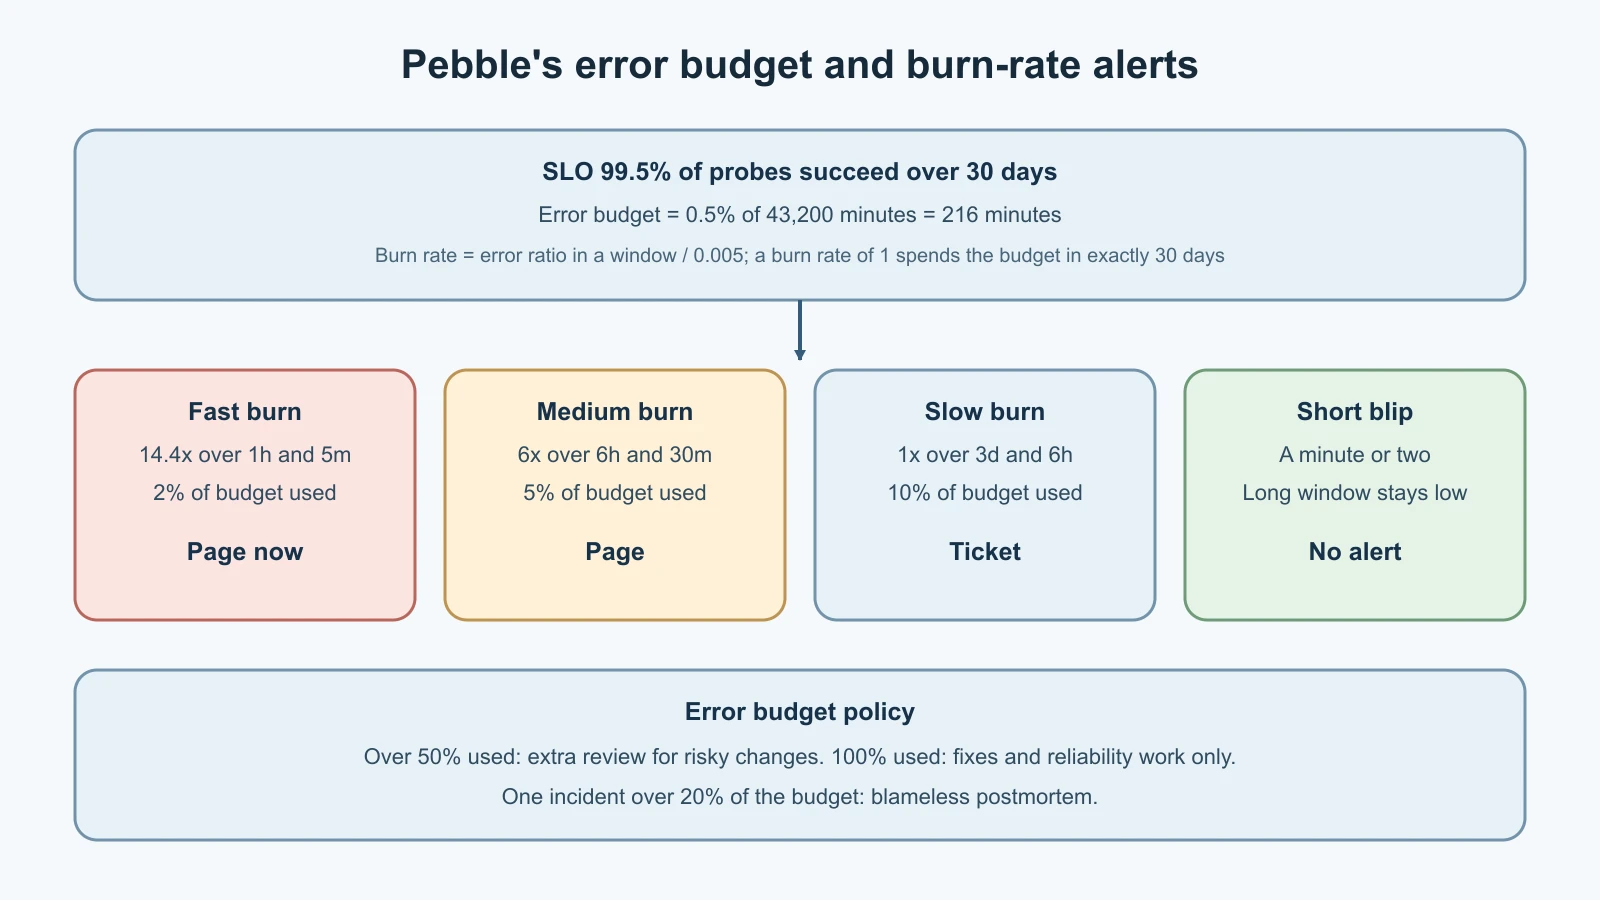
Burn-rate rules for Pebble's probe
These Prometheus rules build on the Blackbox Exporter probe from the metrics lesson. Recording rules compute the error ratio over each window once, and three alerts apply the table above with Pebble's budget of 0.005. Save them as slo-rules.yml beside alerts.yml in the observability folder:
1groups:
2  - name: pebble-slo
3    rules:
4      - record: pebble:probe_errors:ratio_rate5m
5        expr: 1 - avg_over_time(probe_success{job="pebble-blackbox"}[5m])
6      - record: pebble:probe_errors:ratio_rate30m
7        expr: 1 - avg_over_time(probe_success{job="pebble-blackbox"}[30m])
8      - record: pebble:probe_errors:ratio_rate1h
9        expr: 1 - avg_over_time(probe_success{job="pebble-blackbox"}[1h])
10      - record: pebble:probe_errors:ratio_rate6h
11        expr: 1 - avg_over_time(probe_success{job="pebble-blackbox"}[6h])
12      - record: pebble:probe_errors:ratio_rate3d
13        expr: 1 - avg_over_time(probe_success{job="pebble-blackbox"}[3d])
14
15      - alert: PebbleErrorBudgetFastBurn
16        expr: |
17          pebble:probe_errors:ratio_rate1h > (14.4 * 0.005)
18          and
19          pebble:probe_errors:ratio_rate5m > (14.4 * 0.005)
20        for: 2m
21        labels:
22          severity: page
23        annotations:
24          summary: Pebble is burning its error budget fast
25          runbook: Follow the Pebble readiness runbook.
26
27      - alert: PebbleErrorBudgetBurn
28        expr: |
29          pebble:probe_errors:ratio_rate6h > (6 * 0.005)
30          and
31          pebble:probe_errors:ratio_rate30m > (6 * 0.005)
32        for: 5m
33        labels:
34          severity: page
35        annotations:
36          summary: Pebble is burning its error budget
37          runbook: Follow the Pebble readiness runbook.
38
39      - alert: PebbleErrorBudgetSlowBurn
40        expr: |
41          pebble:probe_errors:ratio_rate3d > (1 * 0.005)
42          and
43          pebble:probe_errors:ratio_rate6h > (1 * 0.005)
44        for: 1h
45        labels:
46          severity: ticket
47        annotations:
48          summary: Pebble is slowly using up its error budget
49          runbook: Review recent failures during working hours.
Add - /etc/prometheus/slo-rules.yml under rule_files in prometheus.yml, mount the file into the Prometheus container the same way as alerts.yml, and restart Prometheus. The lab's seven-day retention is enough for the three-day window. Each alert links to a runbook, described below, because an alert without a next step is only noise.
Prometheus ships a tool, promtool, that checks rule files and can unit-test them against invented data, which is the safe way to confirm an alert fires when it should and stays quiet when it should. Save this as slo-rules.test.yml:
1rule_files:
2  - slo-rules.yml
3
4evaluation_interval: 1m
5
6tests:
7  - interval: 1m
8    input_series:
9      - series: 'probe_success{job="pebble-blackbox", instance="http://proxy/readyz"}'
10        values: '1x60 0x30'
11    alert_rule_test:
12      - eval_time: 59m
13        alertname: PebbleErrorBudgetFastBurn
14        exp_alerts: []
15      - eval_time: 75m
16        alertname: PebbleErrorBudgetFastBurn
17        exp_alerts:
18          - exp_labels:
19              severity: page
20              job: pebble-blackbox
21              instance: http://proxy/readyz
22            exp_annotations:
23              summary: Pebble is burning its error budget fast
24              runbook: Follow the Pebble readiness runbook.
The input series describes 60 healthy minutes followed by 30 minutes of failed probes. The test expects no fast-burn alert at minute 59, while everything is healthy, and a firing alert at minute 75, with exactly these labels and annotations. Run both checks from the observability folder:
1promtool check rules slo-rules.yml
2promtool test rules slo-rules.test.yml
promtool is included in the Prometheus download and in the prom/prometheus image, so docker run --rm -v "$PWD:/w" -w /w --entrypoint promtool prom/prometheus:v3.16.0 test rules slo-rules.test.yml works without installing anything. Both commands should report success. Run the tests in CI as well, as in Continuous Integration with GitHub Actions and GitLab CI, so a careless edit to a threshold fails a pull request instead of silently disabling a page.
Report the SLO from probe data
Dashboards show the present. A monthly SLO review needs a summary: availability, budget used and whether any burn-rate rule is currently met. This small Python program computes those from a CSV of probe results, so the same arithmetic can be checked by hand and in tests. Save it as slo_report.py:
1"""Report an availability SLO, its error budget and burn-rate alerts from probe results."""
2
3import csv
4import sys
5from datetime import datetime, timedelta
6
7# Multiwindow, multi-burn-rate rules from Google's SRE workbook (30-day SLO period).
8ALERT_RULES = [
9    ("page", timedelta(hours=1), timedelta(minutes=5), 14.4),
10    ("page", timedelta(hours=6), timedelta(minutes=30), 6.0),
11    ("ticket", timedelta(days=3), timedelta(hours=6), 1.0),
12]
13
14
15def load_checks(path):
16    checks = []
17    with open(path, newline="", encoding="utf-8") as handle:
18        for row in csv.DictReader(handle):
19            when = datetime.fromisoformat(row["timestamp"])
20            if when.tzinfo is None:
21                raise ValueError(f"timestamp needs a time zone: {row['timestamp']}")
22            checks.append((when, row["ok"].strip() == "1"))
23    if not checks:
24        raise ValueError("no probe results in file")
25    checks.sort()
26    return checks
27
28
29def label(window):
30    hours = window.total_seconds() / 3600
31    if hours >= 24:
32        return f"{hours / 24:g}d"
33    return f"{hours:g}h" if hours >= 1 else f"{hours * 60:g}m"
34
35
36def error_ratio(checks, start, end):
37    window = [ok for when, ok in checks if start < when <= end]
38    if not window:
39        return None
40    return window.count(False) / len(window)
41
42
43def burn_rate(checks, end, window, slo):
44    ratio = error_ratio(checks, end - window, end)
45    return None if ratio is None else ratio / (1 - slo)
46
47
48def evaluate(checks, slo, period=timedelta(days=30)):
49    end = checks[-1][0]
50    ratio = error_ratio(checks, end - period, end)
51    alerts = []
52    for severity, long_window, short_window, threshold in ALERT_RULES:
53        long_burn = burn_rate(checks, end, long_window, slo)
54        short_burn = burn_rate(checks, end, short_window, slo)
55        if long_burn is not None and short_burn is not None and \
56                long_burn > threshold and short_burn > threshold:
57            alerts.append(f"{severity}: burn rate {long_burn:.1f} over {label(long_window)} "
58                          f"and {short_burn:.1f} over {label(short_window)} (threshold {threshold:g})")
59    return {
60        "availability": 1 - ratio,
61        "budget_used": ratio / (1 - slo),
62        "alerts": alerts,
63    }
64
65
66def main():
67    if len(sys.argv) != 3:
68        print("usage: python3 slo_report.py probes.csv SLO   (for example 0.995)")
69        return 2
70    slo = float(sys.argv[2])
71    if not 0 < slo < 1:
72        print("SLO must be between 0 and 1, for example 0.995")
73        return 2
74    report = evaluate(load_checks(sys.argv[1]), slo)
75    print(f"SLO target:        {slo:.2%}")
76    print(f"Availability:      {report['availability']:.3%}")
77    print(f"Error budget used: {report['budget_used']:.0%}")
78    for alert in report["alerts"] or ["no burn-rate alert"]:
79        print(f"Alert:             {alert}")
80    return 1 if any(a.startswith("page") for a in report["alerts"]) else 0
81
82
83if __name__ == "__main__":
84    sys.exit(main())
The CSV has one row per check with a timezone-aware timestamp and ok set to 1 or 0. In practice you would export it from Prometheus or from the uptime checker's logs. For learning, generate 30 days of synthetic minute-by-minute checks with a 90-minute outage on day 10 and a 20-minute outage still in progress at the end. Save as make_probes.py:
1"""Write a synthetic 30-day probe log: one check per minute, with two outages."""
2
3import csv
4import sys
5from datetime import datetime, timedelta, timezone
6
7start = datetime(2026, 10, 18, 0, 0, tzinfo=timezone.utc)
8minutes = 30 * 24 * 60
9first_outage = range(10 * 24 * 60, 10 * 24 * 60 + 90)   # 90 minutes on day 10
10recent_outage = range(minutes - 20, minutes)             # the last 20 minutes
11
12with open(sys.argv[1], "w", newline="", encoding="utf-8") as handle:
13    writer = csv.writer(handle)
14    writer.writerow(["timestamp", "ok"])
15    for minute in range(minutes):
16        failed = minute in first_outage or minute in recent_outage
17        writer.writerow([(start + timedelta(minutes=minute + 1)).isoformat(), 0 if failed else 1])
Run both:
1python3 make_probes.py probes.csv
2python3 slo_report.py probes.csv 0.995
3echo "exit code: $?"
On Python 3.12 the output was:
1SLO target:        99.50%
2Availability:      99.745%
3Error budget used: 51%
4Alert:             page: burn rate 66.7 over 1h and 200.0 over 5m (threshold 14.4)
5Alert:             page: burn rate 11.1 over 6h and 133.3 over 30m (threshold 6)
6exit code: 1
Check the numbers by hand. 110 failed checks out of 43,200 is an error ratio of about 0.25%, so availability is 99.745% and half the 0.5% budget is used. The ongoing outage gives 20 failures in the last 60 minutes, an error ratio of one third, which divided by the 0.005 budget is a burn rate of 66.7, far above 14.4, and the last five minutes are all failures. Both page rules match, so the program exits with code 1, which a scheduled job can use to alert. The three-day ticket rule does not match: 20 failures in 4,320 minutes is a burn rate of about 0.93.
Save the tests as test_slo_report.py:
1import os
2import tempfile
3import unittest
4from datetime import datetime, timedelta, timezone
5
6from slo_report import burn_rate, error_ratio, evaluate, load_checks
7
8END = datetime(2026, 11, 16, 12, 0, tzinfo=timezone.utc)
9
10
11def checks(total_minutes, failed_minutes):
12    """One check per minute ending at END; the listed minutes-before-END failed."""
13    return [(END - timedelta(minutes=m), m not in failed_minutes) for m in range(total_minutes)][::-1]
14
15
16class SloReportTest(unittest.TestCase):
17    def test_error_ratio_counts_only_the_window(self):
18        data = checks(120, failed_minutes={0, 1, 90})
19        self.assertAlmostEqual(error_ratio(data, END - timedelta(minutes=60), END), 2 / 60)
20
21    def test_burn_rate_is_error_ratio_over_budget(self):
22        data = checks(60, failed_minutes={0, 1, 2})
23        self.assertAlmostEqual(burn_rate(data, END, timedelta(hours=1), 0.995), (3 / 60) / 0.005)
24
25    def test_short_spike_alone_does_not_page(self):
26        data = checks(3 * 24 * 60, failed_minutes={0, 1})
27        report = evaluate(data, 0.995)
28        self.assertEqual(report["alerts"], [])
29
30    def test_sustained_outage_pages_on_fast_burn(self):
31        data = checks(6 * 60, failed_minutes=set(range(15)))
32        report = evaluate(data, 0.995)
33        self.assertTrue(report["alerts"])
34        self.assertTrue(report["alerts"][0].startswith("page: burn rate"))
35        self.assertIn("over 1h and", report["alerts"][0])
36
37    def test_slow_burn_raises_a_ticket_not_a_page(self):
38        failed = set(range(0, 3 * 24 * 60, 120))   # one failure every two hours for three days
39        report = evaluate(checks(3 * 24 * 60, failed), 0.995)
40        self.assertEqual(len(report["alerts"]), 1)
41        self.assertTrue(report["alerts"][0].startswith("ticket:"))
42
43    def test_budget_used_and_availability(self):
44        report = evaluate(checks(1000, failed_minutes={5, 6}), 0.99)
45        self.assertAlmostEqual(report["availability"], 0.998)
46        self.assertAlmostEqual(report["budget_used"], 0.2)
47
48    def test_loader_rejects_naive_timestamps_and_empty_files(self):
49        with tempfile.TemporaryDirectory() as folder:
50            path = os.path.join(folder, "p.csv")
51            with open(path, "w") as handle:
52                handle.write("timestamp,ok\n2026-11-16T12:00:00,1\n")
53            with self.assertRaises(ValueError):
54                load_checks(path)
55            with open(path, "w") as handle:
56                handle.write("timestamp,ok\n")
57            with self.assertRaises(ValueError):
58                load_checks(path)
59
60
61if __name__ == "__main__":
62    unittest.main()
Run them with python3 -m unittest -v test_slo_report. The seven tests cover window boundaries, the burn-rate formula, a short spike that must not page, a sustained outage that must page, a slow burn that must raise a ticket but not a page, budget arithmetic, and rejecting naive timestamps and empty files. Each important line was also broken on purpose, such as using or instead of and between the two windows, which would page on every short spike, or dividing by the SLO instead of the budget; every change made a test fail.
Incidents: roles, runbooks and calm
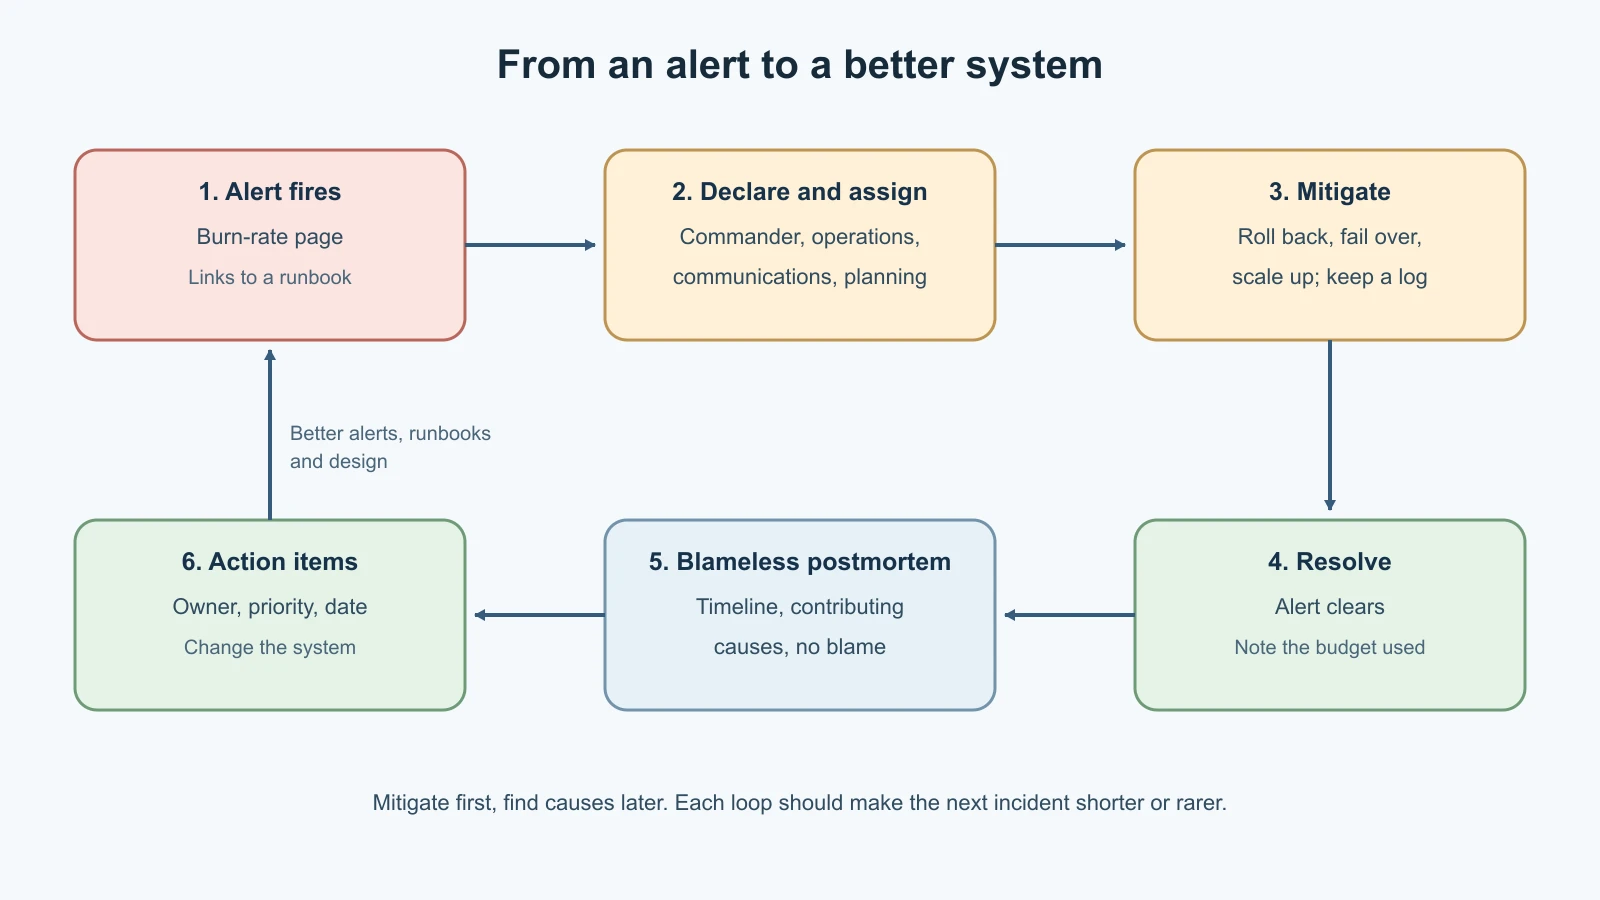
An incident is an unplanned event that disrupts or threatens the service, such as a burn-rate page. Google's SRE book suggests declaring an incident when a second team needs to help, when the problem is visible to customers, or when it is still unsolved after an hour of concentrated work, and advises declaring early and closing quickly rather than starting a formal response hours into a growing problem.
Even a two-person team benefits from naming roles, because they stop everyone from doing the same thing while nobody does the important thing:
| Role | Responsibility |
|---|---|
| Incident commander | Holds the overall picture, assigns work, decides; does not type fixes |
| Operations lead | The only person changing production; applies mitigations and records them |
| Communications lead | Updates stakeholders and users at agreed intervals and keeps the incident log |
| Planning | Tracks follow-up work, handoffs and anything temporarily changed that must be reverted |
In a small team one person can hold several roles, but say out loud who holds which. The first goal is to mitigate, which means restoring service, for example by rolling back a release, failing over or scaling up. Finding the root cause can wait until users are no longer affected. Keep a timestamped log of what was seen, decided and changed; it becomes the backbone of the postmortem. Security incidents, such as suspected intrusions or data exposure, add evidence preservation and legal steps; the Incident Response and Digital Forensics lesson covers those.
Runbooks and standard operating procedures
A runbook is a short, tested set of steps for a known alert or task. A standard operating procedure (SOP) is the same idea for planned work, such as rotating a credential or restoring a backup. Both turn knowledge that lives in one person's head into something anyone on call can follow at 3 a.m. Here is Pebble's runbook for the burn-rate alerts:
1Runbook: Pebble error budget burn (PebbleErrorBudgetFastBurn / PebbleErrorBudgetBurn)
2Owner: Pebble team. Last tested: <date>. Dashboard: Grafana "Pebble probe".
3
41. Acknowledge the page. Open an incident channel and name the incident commander.
52. Check impact: curl -s -o /dev/null -w '%{http_code}\n' https://pebble.example/readyz
6   200 = recovering or intermittent; 503 = Pebble up but not ready; 502 or no answer = Pebble down.
73. If a release went out in the last hour: roll it back first (Argo CD: revert the
8   config commit; Compose: redeploy the previous image tag). Re-check readyz.
94. If 503: check the database (docker compose ps db / kubectl get pods), then the
10   app logs: {job="pebble", service="app"} | json | level="error" in Grafana Explore.
115. If 502: check that app replicas are running and healthy; restart one at a time.
126. Post an update every 30 minutes until resolved, even if nothing changed.
137. After recovery: confirm the alert has cleared and note the budget used.
14   More than 20% used: schedule a postmortem.
Keep runbooks next to the code in Git, link each one from its alert's annotations, and test them in calm conditions, for example during a game day, as in Capstone: Pebble to Production. A runbook nobody has followed in a year is probably wrong.
Blameless postmortems
A postmortem is a written review of an incident: what happened, what the impact was, why it happened and what will change. Google's SRE book describes a postmortem as blameless when it focuses on the contributing causes without blaming any individual or team, and assumes everyone involved acted with good intentions on the information they had. People who fear blame hide mistakes; people who do not fear it report near misses that prevent the next outage.
Write one whenever an incident crosses an agreed threshold. The SRE book's typical triggers include user-visible downtime or degradation beyond a threshold, any data loss, on-call intervention such as a rollback, resolution taking longer than a set limit, and monitoring failing to detect the problem. Pebble's template:
1Postmortem: <title>                      Status: draft / reviewed
2Date and duration: <start>-<end> UTC (<minutes> minutes)
3Authors: <names>                         Incident commander: <name>
4Impact: <who was affected and how>; error budget used: <percent>
5Detection: <alert, user report, or luck?> Time to detect: <minutes>
6Timeline (UTC): <time> <what was seen, decided or changed> ...
7Contributing causes: <conditions that combined; no names, no blame>
8What went well: <worth keeping>
9What was hard: <where people lacked tools, data or permission>
10Action items: <action> | <owner> | <priority> | <due date> | <ticket>
Action items are the point. Each needs an owner and a date, and should change the system, not ask people to "be more careful". Review open postmortem actions at the start of the next planning cycle, and share postmortems widely, so other teams learn from them too.
Backups and disaster recovery you have tested
Two numbers define how much a disaster may cost:
- RPO, recovery point objective: how much data you can afford to lose, measured as time. Pebble's nightly backup from Bash Scripting for Ops gives an RPO of about one day.
- RTO, recovery time objective: how long restoring service may take.
AWS's disaster recovery guidance describes four strategies that trade cost against these objectives. The same ideas apply on any platform:
| Strategy | What is ready in the recovery location | Typical RPO and RTO | Cost |
|---|---|---|---|
| Backup and restore | Backups only; infrastructure is recreated from code when needed | Hours | Lowest |
| Pilot light | Data replicated continuously; core infrastructure deployed but application servers switched off | Tens of minutes | Low |
| Warm standby | A scaled-down but fully working copy that can take traffic immediately | Minutes | Higher |
| Multi-site active/active | Full copies serving traffic in several locations | Near zero for infrastructure failures | Highest |
Notice the dependency on earlier lessons: without infrastructure as code from Terraform and Infrastructure as Code and a pipeline that can redeploy, even the cheapest strategy cannot meet a reasonable RTO. AWS's guidance also stresses a point that applies to every strategy: replication copies corruption and accidental deletes as faithfully as good data, so point-in-time backups remain necessary even in active/active designs, and a backup strategy must include testing restores.
A scripted restore drill
A backup that has never been restored is a hope, not a plan. This script restores the newest backup into a scratch file, checks it is a readable, consistent database, counts the links in it, and fails if the newest backup is older than the RPO allows. Save it beside pebble-backup.sh as restore-drill.sh:
1#!/usr/bin/env bash
2# Restore the newest Pebble backup into a scratch file and prove it is usable.
3# Exit 0 = drill passed, 1 = drill failed (no backup, corrupt, or older than the RPO).
4set -euo pipefail
5
6backup_dir="${BACKUP_DIR:-/var/backups/pebble}"
7max_age_hours="${MAX_AGE_HOURS:-26}"
8
9log() {
10  printf '%s %s\n' "$(date -u +%Y-%m-%dT%H:%M:%SZ)" "$*"
11}
12
13die() {
14  log "FAIL $*" >&2
15  exit 1
16}
17
18[[ "$max_age_hours" =~ ^[1-9][0-9]*$ ]] || die "MAX_AGE_HOURS must be a positive number"
19
20newest=$(printf '%s\n' "$backup_dir"/pebble-*.db.gz | sort | tail -n 1)
21[[ -f "$newest" ]] || die "no backups found in $backup_dir"
22
23work=$(mktemp -d)
24trap 'rm -rf "$work"' EXIT
25started=$(date +%s)
26
27gunzip -c "$newest" > "$work/restored.db" || die "cannot decompress $newest"
28
29result=$(python3 - "$work/restored.db" "$newest" <<'PY'
30import re, sqlite3, sys
31from datetime import datetime, timezone
32try:
33    db = sqlite3.connect(sys.argv[1])
34    check = db.execute("PRAGMA integrity_check").fetchone()[0]
35    links = db.execute("SELECT COUNT(*) FROM links").fetchone()[0]
36except sqlite3.DatabaseError as error:
37    print("unreadable", 0, 0)
38    sys.exit()
39stamp = re.search(r"pebble-(\d{8}T\d{6}Z)\.db\.gz$", sys.argv[2]).group(1)
40taken = datetime.strptime(stamp, "%Y%m%dT%H%M%SZ").replace(tzinfo=timezone.utc)
41age_hours = int((datetime.now(timezone.utc) - taken).total_seconds() // 3600)
42print(check, links, age_hours)
43PY
44)
45read -r check links age_hours <<< "$result"
46elapsed=$(( $(date +%s) - started ))
47
48[[ "$check" == "ok" ]] || die "restored database failed its check ($check): $newest"
49(( age_hours <= max_age_hours )) || die "newest backup is ${age_hours}h old; the RPO allows ${max_age_hours}h"
50log "OK restore drill: $newest has $links links, is ${age_hours}h old, restored in ${elapsed}s"
It reads the backup time from the file name the backup script wrote, so it needs no extra metadata, and it never touches the live database. On the machine used for this lesson, a backup followed immediately by a drill printed:
12026-11-15T19:14:04Z OK backup ./demo/backups/pebble-20261115T191404Z.db.gz (3 links, 402 bytes)
22026-11-15T19:14:04Z OK restore drill: ./demo/backups/pebble-20261115T191404Z.db.gz has 3 links, is 0h old, restored in 0s
The "restored in" figure is a first, honest measurement toward an RTO. Restoring a real database takes far longer, so time each drill and watch the number grow with the data. Save the tests as test-restore-drill.sh:
1#!/usr/bin/env bash
2# Tests for restore-drill.sh using synthetic backups.
3set -uo pipefail
4cd "$(dirname "$0")" || exit 1
5
6passed=0
7failed=0
8tmp=$(mktemp -d)
9trap 'rm -rf "$tmp"' EXIT
10
11check() {
12  local name=$1 expected=$2 actual=$3
13  if [[ "$actual" == "$expected" ]]; then
14    echo "PASS $name"
15    passed=$((passed + 1))
16  else
17    echo "FAIL $name: expected '$expected', got '$actual'"
18    failed=$((failed + 1))
19  fi
20}
21
22make_backup() {
23  local dir=$1 stamp=$2 links=$3
24  mkdir -p "$dir"
25  python3 - "$tmp/src.db" "$links" <<'PY'
26import os, sqlite3, sys
27if os.path.exists(sys.argv[1]):
28    os.remove(sys.argv[1])
29db = sqlite3.connect(sys.argv[1])
30db.execute("CREATE TABLE links (code TEXT PRIMARY KEY, url TEXT NOT NULL, created_at TEXT NOT NULL)")
31for i in range(int(sys.argv[2])):
32    db.execute("INSERT INTO links VALUES (?, ?, ?)", (f"c{i}", f"https://example.com/{i}", "2026-11-16T00:00:00+00:00"))
33db.commit()
34PY
35  gzip -c "$tmp/src.db" > "$dir/pebble-$stamp.db.gz"
36}
37
38now=$(date -u +%Y%m%dT%H%M%SZ)
39
40make_backup "$tmp/fresh" 20260101T000000Z 1
41make_backup "$tmp/fresh" "$now" 3
42out=$(BACKUP_DIR="$tmp/fresh" ./restore-drill.sh)
43check "fresh backup passes" 0 $?
44check "uses the newest backup" 1 "$(grep -c "pebble-$now.db.gz has 3 links" <<< "$out")"
45
46make_backup "$tmp/old" 20260101T000000Z 2
47BACKUP_DIR="$tmp/old" ./restore-drill.sh 2> "$tmp/err"
48check "old backup fails the RPO" 1 $?
49check "old backup error names the RPO" 1 "$(grep -c "RPO allows 26h" "$tmp/err")"
50
51mkdir -p "$tmp/corrupt"
52printf 'not a database' | gzip -c > "$tmp/corrupt/pebble-$now.db.gz"
53BACKUP_DIR="$tmp/corrupt" ./restore-drill.sh 2> /dev/null
54check "corrupt backup fails" 1 $?
55
56mkdir -p "$tmp/empty"
57BACKUP_DIR="$tmp/empty" ./restore-drill.sh 2> "$tmp/err"
58check "missing backups fail" 1 $?
59check "missing backups are reported clearly" 1 "$(grep -c "no backups found" "$tmp/err")"
60
61BACKUP_DIR="$tmp/fresh" MAX_AGE_HOURS=0 ./restore-drill.sh 2> /dev/null
62check "rejects MAX_AGE_HOURS=0" 1 $?
63
64echo "$passed passed, $failed failed"
65[[ $failed -eq 0 ]]
All eight checks pass, ShellCheck reports nothing for either script, and deliberately breaking the script, by picking the oldest backup, skipping the age check, ignoring a failed integrity check or dropping the "no backups" message, makes a test fail. Run the drill weekly with a systemd timer, as you scheduled the backup in the Bash lesson, using OnCalendar=Mon *-*-* 06:00:00 and the same pebble user, and let its failure alert someone. A real drill should go one step further from time to time: restore into a disposable copy of the whole service and confirm that a known short link still redirects.
Cloud design patterns
Design patterns are named, reusable answers to recurring problems in distributed systems. Microsoft's Azure Architecture Center keeps a widely used, technology-neutral catalog of cloud design patterns, and the roadmap groups them into four areas. Pebble already uses several of them:
| Area | Pattern | What it solves | In Pebble |
|---|---|---|---|
| Availability | Health Endpoint Monitoring | Lets tools check that a service works | /healthz and /readyz |
| Availability | Retry with Circuit Breaker | Rides out brief failures but stops hammering a failing dependency | Not yet; the service mesh lesson shows why blind retries on POST are unsafe |
| Availability | Bulkhead | Isolates parts so one failure does not exhaust everything | Separate front and back Compose networks; Kubernetes resource limits per container |
| Availability | Queue-Based Load Leveling | Smooths bursts by putting work in a queue | A future option for slow link checks |
| Availability | Rate Limiting and Throttling | Protects a service from overload | Nginx limit_req returning 429 |
| Data management | Cache-Aside | Loads data into a cache on demand | Valkey caching of link lookups |
| Data management | Sharding | Splits data across several stores | Not needed at Pebble's size |
| Data management | CQRS and Materialized View | Separates or precomputes reads | A future "most visited links" report |
| Design and implementation | Sidecar and Ambassador | Adds features beside a service without changing it | Istio's Envoy sidecar |
| Design and implementation | Gateway Offloading and Routing | Moves TLS, limits and routing into one gateway | Nginx terminating TLS in front of Pebble |
| Design and implementation | Strangler Fig | Replaces a legacy system piece by piece | Not needed yet; useful when replacing an older system gradually |
| Management and monitoring | External Configuration Store | Keeps configuration outside the deployment package | Environment variables, ConfigMaps, secret managers |
| Management and monitoring | Deployment Stamps | Deploys independent copies of a whole stack | One stack per environment from the same code |
Microsoft's guidance is to choose a pattern for the problem you have, not the technology you want to use, and to accept that every pattern has trade-offs. A circuit breaker adds states and tuning; a cache adds staleness and invalidation; sharding complicates queries and migrations. Patterns also combine, for example Retry with Circuit Breaker, so a client retries short faults but stops once a fault persists.
Change safely
Most outages are caused by changes, so reliability work and delivery work meet in the change process. Before any production change that is not routine, Pebble's team fills in this checklist in the pull request:
1Change checklist
2[ ] What changes, and why now? Link the ticket or SLO review.
3[ ] Error budget remaining: <percent>. Policy allows this change: yes / no.
4[ ] Blast radius: which users and services are affected if it goes wrong?
5[ ] Tested in staging with the same artifact that will reach production.
6[ ] Rollout: rolling / blue-green / canary. Stop condition: <metric and threshold>.
7[ ] Rollback: exact command or Git revert, and how long it takes. Data changes reversible?
8[ ] Who watches the dashboards during and after, and for how long?
9[ ] Runbooks and alerts updated if behavior changes.
The rollout options and rollback rules come from Continuous Delivery and Deployment Strategies; the checklist makes sure someone actually considered them before pressing merge.
Templates for Pebble
The SLO sheet and the disaster recovery plan complete the set:
1SLO sheet: Pebble redirects                        Review: monthly
2SLI: successful readiness probes / all probes (later: redirects under 300 ms / all redirects)
3SLO: 99.5% over rolling 30 days                    Error budget: 216 minutes
4Alerts: fast burn 14.4x (1h/5m) page; burn 6x (6h/30m) page; slow burn 1x (3d/6h) ticket
5Policy: >50% used = extra review; 100% used = fixes only; >20% in one incident = postmortem
6Owner: <name> Last review: <date> | Budget used: <percent>1Disaster recovery plan: Pebble Last tested: <date>
2Strategy: backup and restore RPO: 26 hours (nightly backup) RTO: 4 hours
3Backups: /var/backups/pebble, nightly 02:30, keep 7; copy off-site daily to <location>
4Recreate infrastructure: terraform apply in pebble-aws (state in S3)
5Restore data: newest backup -> restore-drill.sh checks it -> copy to /var/lib/pebble/pebble.db
6Redeploy app: Argo CD sync of the last known-good config commit
7Verify: /readyz 200, a known short link redirects, burn-rate alerts clear
8Contacts: <incident commander>, <cloud account owner>
9Drill schedule: restore drill weekly (automated); full recovery rehearsal quarterlyMistakes beginners make
- Aiming for 100% availability, or copying another company's SLO without measuring your own service.
- Choosing SLIs users cannot feel, such as CPU, instead of request success and latency.
- Setting an SLA stricter than the internal SLO.
- Paging on every failed check instead of on burn rate.
- Writing alerts with no runbook, or runbooks nobody has tested.
- Letting several people change production at once during an incident.
- Searching for root cause before mitigating user impact.
- Naming and blaming a person in a postmortem, or writing action items like "be more careful".
- Treating replication as a backup, or never testing a restore.
- Adopting a design pattern because it is fashionable rather than because it solves a measured problem.
Recap and try it yourself
Reliability is a target chosen for users, not a maximum. SLIs measure what users experience, SLOs set targets over a window, and the gap between the SLO and 100% is an error budget that guides decisions through a written policy. Burn-rate alerts over paired long and short windows page for fast outages, open tickets for slow ones and ignore harmless blips; promtool can unit-test them. Incidents go better with named roles, mitigation first and a tested runbook, and every serious one ends in a blameless postmortem with owned action items. RPO and RTO define how much data and time a disaster may cost, the four disaster recovery strategies trade money for speed, and only a tested restore proves a backup. Cloud design patterns name proven solutions; Pebble already uses health endpoints, cache-aside, gateway offloading, rate limiting and sidecars.
Try it yourself:
- Change the synthetic outage in
make_probes.pyto 300 minutes on day 10 and run the report. How much budget is used, and what does Pebble's policy say the team should do now? - Add a second test case to
slo-rules.test.ymlthat expectsPebbleErrorBudgetFastBurnnot to fire for a single failed probe, and runpromtool test rules. - Run the restore drill against your real backups on the Ubuntu server, then schedule it weekly with a systemd timer and confirm a failure shows in
systemctl status. - Pick a past outage from your own experience, or invent one for Pebble, and write a blameless postmortem with at least three action items, each with an owner and a date.
- Choose one pattern Pebble does not use yet, such as Circuit Breaker for its PostgreSQL connection, and write down the problem it would solve, how you would test it, and the new failure modes it adds.
Sources checked on 16 November 2026: Google SRE book chapters on embracing risk, service level objectives, managing incidents and postmortem culture; the SRE workbook on alerting on SLOs and its example error budget policy; Prometheus recording rules and unit testing for rules; AWS disaster recovery options in the cloud; Microsoft's cloud design patterns catalog; and the roadmap.sh DevOps roadmap. Pebble, its outages and its probe data are fictional.