
DevOps course · lesson 11 of 24
- 1What Is DevOps?
- 2A Language and a Service to Operate
- 3Linux and the Terminal
- 4Bash Scripting for Ops
- 5Git and Collaboration
- 6Networking for DevOps
- 7Web Servers, Proxies and Load Balancers
- 8Docker for DevOps
- 9Docker Compose and Multi-Service Apps
- 10Cloud Providers: AWS, Azure and Google Cloud
- 11Serverless Functions and Platforms
- 12Terraform and Infrastructure as Code
- 13Ansible and Configuration Management
- 14Continuous Integration with GitHub Actions and GitLab CI
- 15Continuous Delivery and Deployment Strategies
- 16Secret Management
- 17Kubernetes Basics
- 18Kubernetes in Practice
- 19GitOps with Argo CD and Flux
- 20Service Mesh: Istio, Linkerd, Consul and Envoy
- 21Metrics and Alerting with Prometheus and Grafana
- 22Logs and Tracing with Loki, Elastic and OpenTelemetry
- 23Reliability, SLOs and Cloud Design Patterns
- 24Capstone: Pebble to Production
After this lesson, you will be able to explain what "serverless" means and what it does not mean, describe how a function is triggered, run, scaled and billed, recognize cold starts and how to reduce them, estimate a function's cost from its memory and duration, and decide when serverless suits a workload better than a VM or a container. You will build a small, tested uptime checker that runs every five minutes on AWS Lambda, deploy it with the AWS Serverless Application Model (SAM), see its results as a CloudWatch metric, and compare the same idea on Cloudflare Workers and other platforms.
In Cloud Providers: AWS, Azure and Google Cloud you rented a virtual machine, installed Docker on it with cloud-init and ran Pebble. You chose the machine size, kept the operating system patched and paid for every hour it ran, busy or idle. Serverless platforms take that work away. You hand over code or a container image and the platform decides where it runs, starts as many copies as the traffic needs, and stops them all when there is nothing to do. The servers still exist, of course; you just never see or manage them.
What serverless means
Serverless is a family of services that share four properties:
- No servers to manage. No operating system to patch, no machine size to pick, no capacity to plan.
- Automatic scaling, including to zero. Copies start when work arrives and stop when it ends.
- Pay for use. You pay per request and for the time your code runs, not for idle machines.
- Event-driven. Code runs in response to something: an HTTP request, a file upload, a message in a queue, a database change or a schedule.
The term covers several kinds of product, and it helps to keep them apart:
| Kind | What you hand over | Examples |
|---|---|---|
| Functions as a service (FaaS) | A single function and its dependencies | AWS Lambda, Azure Functions, Google Cloud Run functions |
| Serverless containers | A container image that listens on a port | Google Cloud Run, AWS Fargate, Azure Container Apps |
| Edge functions | Small functions run in many locations close to users | Cloudflare Workers, Vercel Functions, Netlify Functions |
| Platform as a service (PaaS) | A Git repository or image; the platform builds and runs it | Heroku, Render, Railway |
PaaS platforms are older than the word "serverless" and often keep at least one copy running, but they share the main promise: you deploy an application, not a server.
How a function runs
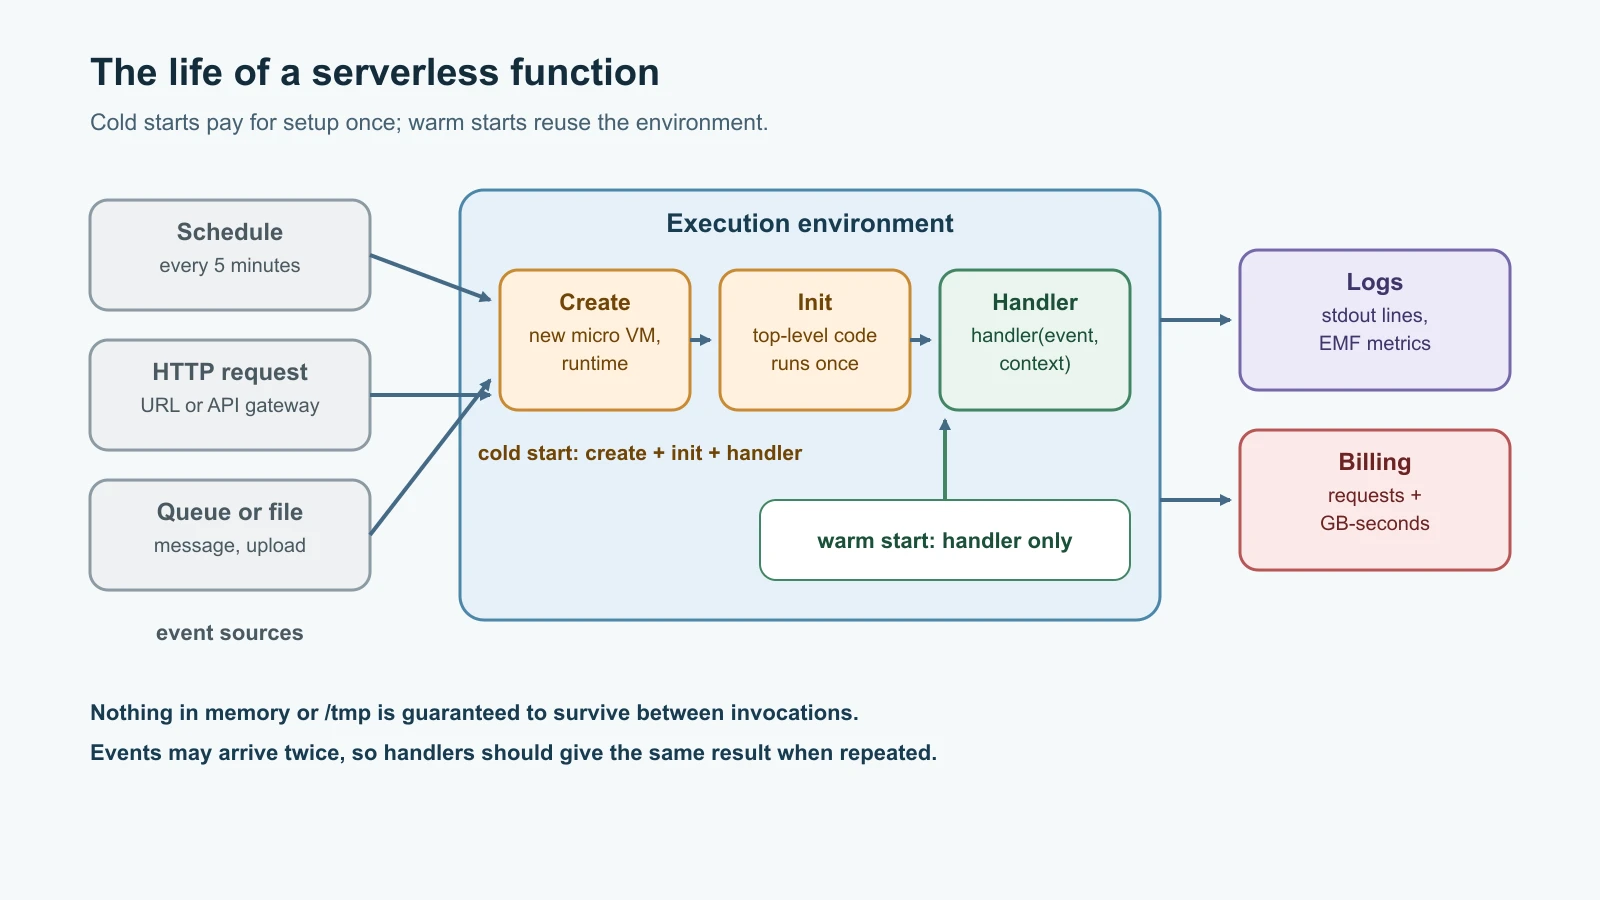
A function is ordinary code with one entry point, the handler, which the platform calls with an event describing what happened. In Python on AWS Lambda, a handler looks like def handler(event, context):, where event is a dictionary, for example the HTTP request or the schedule details, and context carries information such as how much time is left.
When an event arrives and no copy of the function is ready, the platform creates an execution environment: an isolated, lightweight virtual machine with the language runtime, your code and its configuration. It then runs your module's top-level code, the initialization phase, and finally calls the handler. This first, slower path is a cold start. When the invocation finishes, the platform usually keeps the environment for a while, and the next event reuses it, skipping straight to the handler: a warm start. If many events arrive at once, the platform creates more environments in parallel; each one handles one event at a time on Lambda.
Three consequences shape how you write functions:
- Do expensive setup once, at the top level. Creating database connections or loading configuration outside the handler means warm invocations reuse them.
- Do not rely on anything surviving. Environments are reused when convenient and discarded without notice, so files in
/tmpand values in memory are a cache at most, never storage. The twelve-factor "stateless processes" rule from A Language and a Service to Operate applies even more strictly here. - Expect retries. Asynchronous events, such as schedules and queues, may be delivered more than once or retried after a failure, so a function should give the same result if it runs twice with the same input. This property is called idempotency.
AWS's documentation now calls these classic functions Lambda Event Functions and also offers Lambda Web Functions for running HTTP servers; this lesson uses event functions, which is still what most people mean by "Lambda".
Limits that shape designs
Every platform sets limits. The defaults for AWS Lambda at the time of writing show the typical shape:
| Limit | Lambda event functions |
|---|---|
| Maximum run time per invocation | 900 seconds, which is 15 minutes |
| Memory | 128 MB to 10,240 MB; CPU power grows with memory, reaching the equivalent of one vCPU at 1,769 MB |
| Request and response size, synchronous | 6 MB each |
Temporary storage in /tmp | 512 MB to 10,240 MB |
| Deployment package | 50 MB zipped for direct upload, 250 MB unzipped, or a container image up to 10 GB |
| Concurrent executions per region | 1,000 by default; new accounts start lower and are raised automatically with use |
Long-running jobs, large uploads and work that needs a steady connection, such as WebSockets held for hours, fit badly into these limits. Short, event-driven tasks fit well.
How serverless is billed
Function platforms charge for two things: the number of requests, and compute time measured in GB-seconds, the memory you configured multiplied by how long the code ran. On AWS Lambda in the US East (N. Virginia) region at the time of writing, requests cost 0.20 US dollars per million, and compute costs 0.0000166667 dollars per GB-second on x86 and 0.0000133334 dollars on Arm. The free tier includes one million requests and 400,000 GB-seconds per month.
Work through the uptime checker you are about to build. It runs every five minutes, which is 12 runs an hour, 288 a day and 8,640 in a 30-day month. It is configured with 128 MB, which is 0.125 GB. If each run takes about 100 milliseconds, the monthly compute is:
That is far inside the free tier, and even without it the compute would cost well under one cent. This is serverless at its best: a small job that runs often but briefly. The comparison flips for steady, heavy traffic. A function busy around the clock can cost more than a VM or container running the same work, because you pay a premium for not managing capacity. Do this arithmetic with current prices from the provider's page before choosing.
Cold starts and how to reduce them
A cold start adds the time to create an environment and run initialization before the handler. For a small Python function it is usually a fraction of a second; large packages, heavy frameworks and functions attached to private networks take longer. For a schedule that runs every five minutes nobody notices. For a user waiting on a web page, a slow first request can matter.
Ways to reduce the effect, roughly from cheapest to most expensive:
- Keep the package small. Fewer and lighter dependencies load faster. The uptime checker uses only Python's standard library.
- Choose a lighter runtime. Interpreted languages such as Python and Node.js start quickly; heavyweight frameworks do not.
- Initialize once. Put clients and configuration outside the handler, so the cost is paid once per environment.
- Add memory. On Lambda, more memory also means more CPU, which can make both initialization and the handler faster, sometimes for a similar total cost.
- Keep environments warm. Lambda's provisioned concurrency, Azure's always-ready instances and minimum instance counts on Cloud Run keep copies ready in exchange for paying while they wait, which gives up part of the scale-to-zero saving.
Build Pebble's uptime checker
Pebble's own health checks only tell you what Pebble thinks of itself. An external uptime check asks from outside, the way a user would, and catches problems that internal checks cannot see, such as DNS, certificates, firewalls or the whole server being down. It is a perfect serverless job: small, periodic and independent of the system it watches.
Create a folder called pebble-uptime with a src folder inside it, and save this as src/uptime.py:
1"""Check Pebble's readiness from outside and publish the result as a CloudWatch metric."""
2
3import json
4import os
5import time
6import urllib.error
7import urllib.request
8
9
10def check(url, timeout=5):
11    started = time.monotonic()
12    try:
13        with urllib.request.urlopen(url, timeout=timeout) as response:
14            status = response.status
15    except urllib.error.HTTPError as error:
16        status = error.code
17    except (urllib.error.URLError, TimeoutError, OSError):
18        status = 0
19    latency_ms = round((time.monotonic() - started) * 1000)
20    return {"up": status == 200, "status": status, "latency_ms": latency_ms}
21
22
23def metric_line(target, result):
24    """One log line in CloudWatch Embedded Metric Format: logs and metrics in one write."""
25    return json.dumps({
26        "_aws": {
27            "Timestamp": int(time.time() * 1000),
28            "CloudWatchMetrics": [{
29                "Namespace": "Pebble",
30                "Dimensions": [["Target"]],
31                "Metrics": [
32                    {"Name": "Up", "Unit": "Count"},
33                    {"Name": "LatencyMs", "Unit": "Milliseconds"},
34                ],
35            }],
36        },
37        "Target": target,
38        "Up": 1 if result["up"] else 0,
39        "LatencyMs": result["latency_ms"],
40        "Status": result["status"],
41    })
42
43
44def handler(event, context):
45    base_url = os.environ["PEBBLE_URL"].rstrip("/")
46    result = check(base_url + "/readyz")
47    print(metric_line(base_url, result))
48    return result
check requests /readyz with a five-second timeout and measures how long it took. A 200 means up. An HTTP error such as Pebble's 503 keeps its status code, and anything that never got an HTTP answer, such as a refused connection, a DNS failure or a timeout, is recorded as status 0. The function never raises an exception for a failed check, because a down service is a normal result for a monitor, not a crash of the monitor.
metric_line prints one JSON line in CloudWatch's Embedded Metric Format (EMF). The _aws block tells CloudWatch that Up and LatencyMs in the same line are metrics in a Pebble namespace, broken down by Target. CloudWatch Logs turns each such line into metric data points automatically, so the function needs no SDK, no API calls and no extra permissions to publish metrics. The same line is also a readable log entry.
Test it locally
Save this as test_uptime.py in the pebble-uptime folder, next to src:
1import json
2import os
3import sys
4import threading
5import unittest
6from contextlib import redirect_stdout
7from http.server import BaseHTTPRequestHandler, ThreadingHTTPServer
8from io import StringIO
9
10sys.path.insert(0, os.path.join(os.path.dirname(__file__), "src"))
11import uptime  # noqa: E402
12
13
14def serve(status):
15    paths = []
16
17    class Handler(BaseHTTPRequestHandler):
18        def do_GET(self):
19            paths.append(self.path)
20            self.send_response(status)
21            self.send_header("Content-Length", "0")
22            self.end_headers()
23
24        def log_message(self, *args):
25            pass
26
27    server = ThreadingHTTPServer(("127.0.0.1", 0), Handler)
28    server.paths = paths
29    threading.Thread(target=server.serve_forever, daemon=True).start()
30    return server, f"http://127.0.0.1:{server.server_address[1]}"
31
32
33class UptimeTest(unittest.TestCase):
34    def run_handler(self, url):
35        os.environ["PEBBLE_URL"] = url
36        output = StringIO()
37        with redirect_stdout(output):
38            result = uptime.handler({}, None)
39        return result, json.loads(output.getvalue())
40
41    def test_ready_service_is_up(self):
42        server, url = serve(200)
43        try:
44            result, line = self.run_handler(url + "/")
45        finally:
46            server.shutdown()
47        self.assertEqual((result["up"], result["status"]), (True, 200))
48        self.assertEqual(server.paths, ["/readyz"])
49        self.assertEqual((line["Up"], line["Target"]), (1, url))
50
51    def test_not_ready_service_is_down(self):
52        server, url = serve(503)
53        try:
54            result, line = self.run_handler(url)
55        finally:
56            server.shutdown()
57        self.assertEqual((result["up"], result["status"], line["Up"]), (False, 503, 0))
58
59    def test_unreachable_service_is_down_with_status_zero(self):
60        server, url = serve(200)
61        server.shutdown()
62        server.server_close()
63        result, line = self.run_handler(url)
64        self.assertEqual((result["up"], result["status"], line["Status"]), (False, 0, 0))
65
66    def test_metric_line_is_valid_embedded_metric_format(self):
67        line = json.loads(uptime.metric_line("https://x", {"up": True, "status": 200, "latency_ms": 12}))
68        directive = line["_aws"]["CloudWatchMetrics"][0]
69        self.assertEqual(directive["Namespace"], "Pebble")
70        for metric in directive["Metrics"]:
71            self.assertIn(metric["Name"], line)
72        for dimension in directive["Dimensions"][0]:
73            self.assertIn(dimension, line)
74        self.assertIsInstance(line["_aws"]["Timestamp"], int)
75
76
77if __name__ == "__main__":
78    unittest.main()
The tests start a tiny HTTP server on a free port that returns a chosen status code and records which path was requested. They check a ready target, a target returning 503, a target that is not listening at all, and the structure of the metric line, including that every metric and dimension named in the _aws block is present in the line. Run them:
1python3 -m unittest -v test_uptimeAll four pass. Breaking the code on purpose, by treating any status below 500 as up, dropping the HTTP error's status code, always reporting Up as 1, checking the base URL instead of /readyz, or writing the timestamp in seconds instead of milliseconds, makes a test fail every time.
You can also call the handler directly against a local Pebble from earlier lessons. With Pebble running on port 8080 and then stopped, the output on the machine used for this lesson was:
1PEBBLE_URL=http://localhost:8080 python3 -c 'import sys; sys.path.insert(0, "src"); import uptime; print(uptime.handler({}, None))'1{"_aws": {"Timestamp": 1794568179391, "CloudWatchMetrics": [{"Namespace": "Pebble", "Dimensions": [["Target"]], "Metrics": [{"Name": "Up", "Unit": "Count"}, {"Name": "LatencyMs", "Unit": "Milliseconds"}]}]}, "Target": "http://localhost:8080", "Up": 1, "LatencyMs": 16, "Status": 200}
2{'up': True, 'status': 200, 'latency_ms': 16}
3{"_aws": {"Timestamp": 1794568180482, "CloudWatchMetrics": [{"Namespace": "Pebble", "Dimensions": [["Target"]], "Metrics": [{"Name": "Up", "Unit": "Count"}, {"Name": "LatencyMs", "Unit": "Milliseconds"}]}]}, "Target": "http://localhost:8080", "Up": 0, "LatencyMs": 15, "Status": 0}
4{'up': False, 'status': 0, 'latency_ms': 15}Deploy with AWS SAM
The AWS Serverless Application Model (SAM) is a short way to describe serverless resources in a template, plus a command-line tool that builds and deploys them through CloudFormation, AWS's infrastructure-as-code service. Save this as template.yaml in the pebble-uptime folder:
1AWSTemplateFormatVersion: "2010-09-09"
2Transform: AWS::Serverless-2016-10-31
3Description: Pebble uptime checker, runs every five minutes
4
5Parameters:
6  PebbleUrl:
7    Type: String
8    Description: Public base URL of Pebble, for example https://pebble.example
9
10Resources:
11  UptimeChecker:
12    Type: AWS::Serverless::Function
13    Properties:
14      CodeUri: src/
15      Handler: uptime.handler
16      Runtime: python3.14
17      Architectures: [arm64]
18      MemorySize: 128
19      Timeout: 10
20      Environment:
21        Variables:
22          PEBBLE_URL: !Ref PebbleUrl
23      Events:
24        EveryFiveMinutes:
25          Type: ScheduleV2
26          Properties:
27            ScheduleExpression: rate(5 minutes)
28
29  UptimeCheckerLogs:
30    Type: AWS::Logs::LogGroup
31    Properties:
32      LogGroupName: !Sub /aws/lambda/${UptimeChecker}
33      RetentionInDays: 14
34
35Outputs:
36  FunctionName:
37    Value: !Ref UptimeChecker
The template declares one function and one log group:
Runtime: python3.14andArchitectures: [arm64]. Lambda supports both x86 and Arm for every runtime; Arm is a little cheaper per GB-second. At the time of writing, Python 3.15 is available on Lambda only as a public preview, which is not meant for production, so this function uses 3.14, supported until June 2029.MemorySize: 128andTimeout: 10keep the function small and stop it from hanging. The timeout is longer than the check's own five-second limit, so the function always finishes and logs its result.PEBBLE_URLcomes from a parameter, so the same template can watch test and production.- The
ScheduleV2event creates an Amazon EventBridge Scheduler schedule that invokes the function every five minutes. SAM also creates the IAM roles it needs: one for the function, with permission only to write its own logs, and one for the scheduler to invoke the function. You write no permission policies by hand. - The log group keeps logs for 14 days. Without it, Lambda's log group keeps logs forever, and old logs quietly accumulate storage charges.
Install the SAM CLI from AWS's documentation, sign in with aws configure sso as in the previous lesson, and deploy:
1sam build
2sam deploy --guided
sam build packages the code into .aws-sam/. sam deploy --guided asks for a stack name, such as pebble-uptime, the region, and the PebbleUrl parameter, which should be a public address where Pebble's /readyz answers, such as the cloud VM from the previous lesson or your HTTPS domain. It shows the resources it will create and asks for confirmation, then saves your answers in samconfig.toml, so later deployments are just sam deploy.
Invoke it once by hand and read the logs instead of waiting five minutes:
1sam remote invoke UptimeChecker --stack-name pebble-uptime
2sam logs --name UptimeChecker --stack-name pebble-uptime --tail
The invoke prints the handler's return value, such as {"up": true, "status": 200, "latency_ms": ...}, and the logs show the EMF line. In the CloudWatch console, the Pebble namespace now holds Up and LatencyMs metrics for your target. In Metrics and Alerting you will put an alarm on Up so a failed check pages someone.
When you are done, remove everything the stack created, including the function, the schedule, the roles and the log group, with one command:
1sam delete --stack-name pebble-uptimeThe same checker on Cloudflare Workers
Cloudflare Workers run JavaScript and WebAssembly in Cloudflare's network, close to users, using lightweight isolates rather than full containers, which keeps cold starts very short. Workers can also run on a schedule with cron triggers. Here is the uptime checker as a Worker. Save it as src/index.js in a separate folder:
1export default {
2  async scheduled(controller, env, ctx) {
3    const started = Date.now();
4    let status = 0;
5    try {
6      const response = await fetch(`${env.PEBBLE_URL}/readyz`, {
7        signal: AbortSignal.timeout(5000),
8      });
9      status = response.status;
10    } catch {
11      status = 0;
12    }
13    console.log(JSON.stringify({
14      target: env.PEBBLE_URL,
15      up: status === 200,
16      status,
17      latency_ms: Date.now() - started,
18    }));
19  },
20};
And its configuration as wrangler.jsonc, with your own Pebble address:
1{
2  "name": "pebble-uptime",
3  "main": "src/index.js",
4  "compatibility_date": "2026-11-01",
5  "triggers": { "crons": ["*/5 * * * *"] },
6  "vars": { "PEBBLE_URL": "https://pebble.example" }
7}
*/5 * * * * is the cron expression for every five minutes, evaluated in UTC. Deploy it with Cloudflare's wrangler tool by running npx wrangler deploy in that folder, then test the schedule locally with npx wrangler dev --test-scheduled. The structure is the same as the Lambda version: an event, a handler, a timeout, a JSON log line and no servers. The JSON log is plain rather than EMF, because metrics on Cloudflare work differently from CloudWatch.
Other platforms worth knowing
| Platform | What it runs | Notes |
|---|---|---|
| Azure Functions | Functions in many languages | Microsoft recommends the Flex Consumption plan for new serverless apps; the original Consumption plan is now a legacy option |
| Google Cloud Run functions | Functions, built and run on Cloud Run | The product formerly called Cloud Functions |
| Google Cloud Run | Any container that listens on a port | Pebble's existing image runs here unchanged, scaling to zero between requests |
| AWS Fargate | Containers for ECS and EKS without managing servers | Billed per second for the CPU and memory requested, not per request |
| Vercel Functions | Functions next to web front ends | Common with Next.js sites |
| Netlify Functions | Functions next to static sites | Built on AWS Lambda |
| Heroku, Render, Railway | Whole applications from Git or images | Push to deploy, managed databases, simple scaling; usually at least one instance stays running |
Notice the row for Cloud Run. Serverless does not have to mean rewriting an application as functions. If you already have a container image that reads its port from the environment and keeps no state on disk, as Pebble's does, a serverless container platform can run it as is.
When serverless fits and when it does not
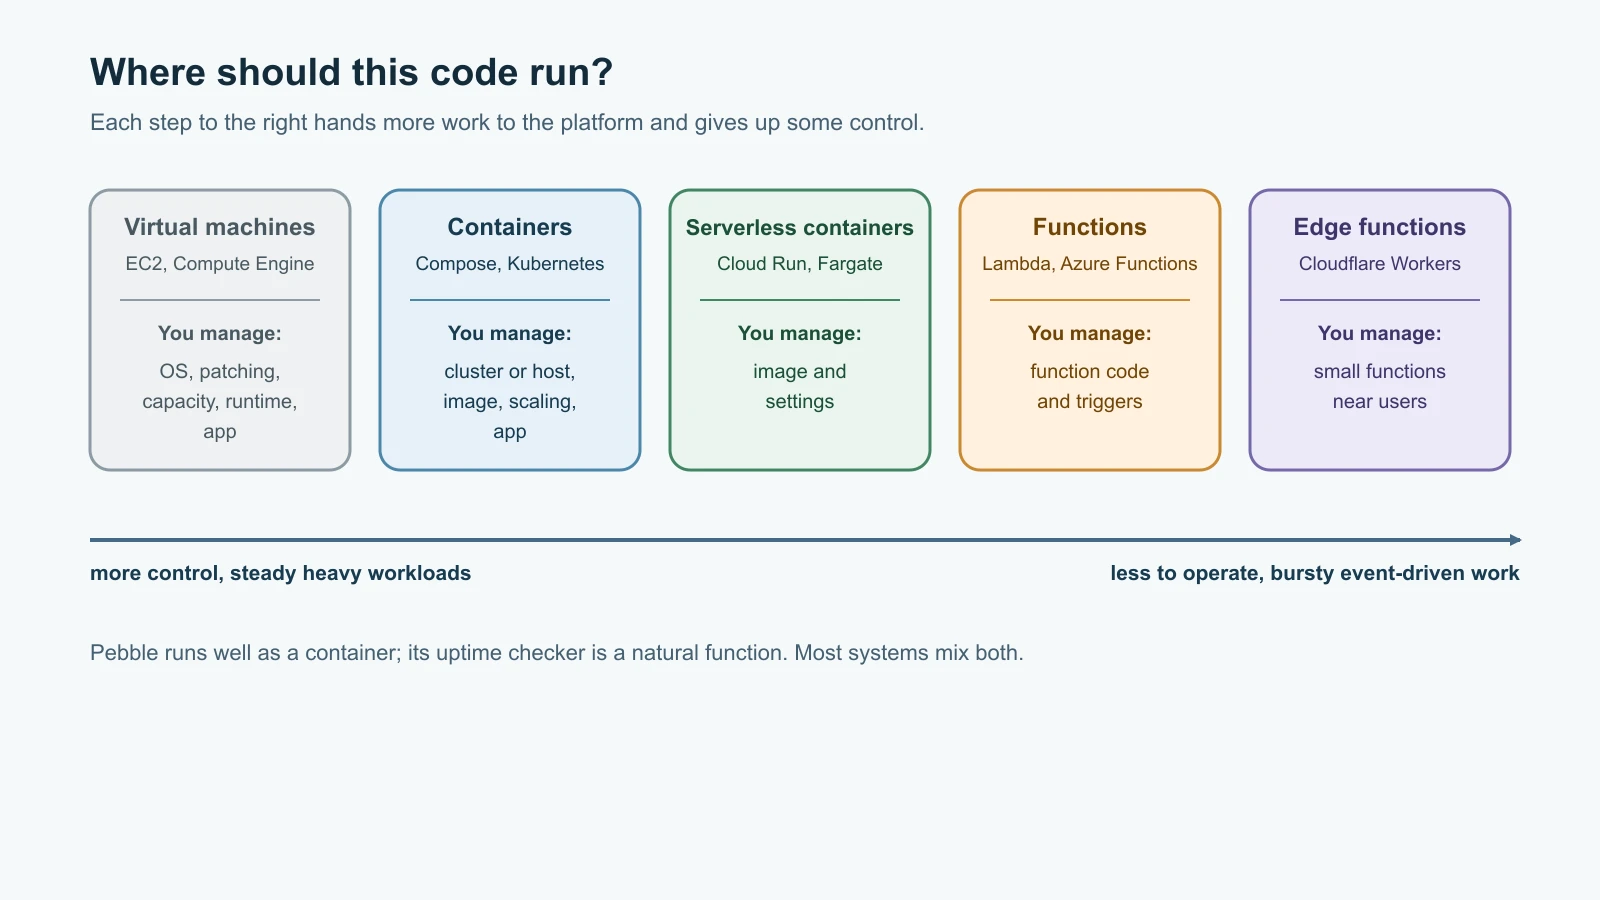
Serverless fits well when work is event-driven, bursty or periodic: scheduled jobs like the uptime checker, processing uploaded files, reacting to queue messages, webhooks, small APIs with uneven traffic, and glue between services. It fits less well when work is long-running, steady and heavy, needs special hardware, keeps long connections open, or depends on low and predictable latency on every request. It also makes local testing and debugging harder and ties you more closely to one provider's events and limits.
For Pebble itself, a function would be an awkward fit: every invocation would open new PostgreSQL connections, which databases handle poorly at scale without a connection pooler, and Pebble is already a tidy container. The uptime checker, on the other hand, is a natural function. Most real systems mix both: containers or VMs for the core service, and functions for the small jobs around it.
Mistakes beginners make
- Thinking "serverless" means there is nothing to operate: you still own code, dependencies, permissions, logs, alarms and cost.
- Keeping state in memory or
/tmpand expecting it to be there next time. - Writing functions that break when an event is delivered twice.
- Setting the timeout too low, or leaving it at the maximum so a hung call runs and bills for 15 minutes.
- Ignoring cold starts for user-facing paths, or overpaying to remove them where nobody would notice.
- Opening a new database connection per invocation at high volume.
- Leaving log groups with no retention, so logs pile up forever.
- Assuming per-request pricing is always cheaper than a VM for steady, heavy traffic.
- Granting a function broad permissions such as full administrator access.
- Using a preview runtime for production work.
Recap and try it yourself
Serverless platforms run your code or containers without exposing servers, scale them automatically, including to zero, and bill for use. Functions are triggered by events; the first invocation in a new environment is a cold start, later ones reuse it, and nothing in memory or /tmp can be relied on. Lambda allows up to 15 minutes and 10,240 MB per invocation and bills per request and per GB-second, so a small periodic job like Pebble's uptime checker costs almost nothing. The checker is tested locally, publishes metrics through Embedded Metric Format log lines, deploys with a short SAM template and is removed with sam delete. Cloudflare Workers, Azure Functions, Cloud Run, Vercel, Netlify and PaaS platforms offer the same idea with different trade-offs; choose serverless for event-driven and bursty work, and containers or VMs for steady, heavy services.
Try it yourself:
- Run the tests, then add one that checks the latency of a slow target: make the test server sleep for one second and assert that
latency_msis at least 1,000. - Deploy the checker with SAM against a real Pebble, stop Pebble, invoke the function by hand and find the
Upvalue of 0 in CloudWatch. - Change
MemorySizeto 512, redeploy, invoke it a few times, and compare theDurationandInit Durationvalues in theREPORTlines of the logs. - Calculate the monthly GB-seconds if the checker ran every minute with 256 MB and took 300 milliseconds per run. Is it still inside the free tier?
Sources checked on 13 November 2026: AWS Lambda runtimes, quotas and pricing; AWS SAM ScheduleV2 events and the SAM CLI; CloudWatch's Embedded Metric Format specification; Cloudflare Workers cron triggers; Microsoft's Azure Functions hosting options; Google Cloud Run functions and Cloud Run; and the roadmap.sh DevOps roadmap. Prices and limits change; check the providers' pages before relying on them. Pebble is fictional.