
DevOps course · lesson 1 of 24
- 1What Is DevOps?
- 2A Language and a Service to Operate
- 3Linux and the Terminal
- 4Bash Scripting for Ops
- 5Git and Collaboration
- 6Networking for DevOps
- 7Web Servers, Proxies and Load Balancers
- 8Docker for DevOps
- 9Docker Compose and Multi-Service Apps
- 10Cloud Providers: AWS, Azure and Google Cloud
- 11Serverless Functions and Platforms
- 12Terraform and Infrastructure as Code
- 13Ansible and Configuration Management
- 14Continuous Integration with GitHub Actions and GitLab CI
- 15Continuous Delivery and Deployment Strategies
- 16Secret Management
- 17Kubernetes Basics
- 18Kubernetes in Practice
- 19GitOps with Argo CD and Flux
- 20Service Mesh: Istio, Linkerd, Consul and Envoy
- 21Metrics and Alerting with Prometheus and Grafana
- 22Logs and Tracing with Loki, Elastic and OpenTelemetry
- 23Reliability, SLOs and Cloud Design Patterns
- 24Capstone: Pebble to Production
After this lesson, you will be able to explain DevOps in plain words, describe the stages of the DevOps lifecycle, tell DevOps, site reliability engineering (SRE) and platform engineering apart, name the five DORA delivery metrics, and calculate them from a small deployment log with a tested Python script. You will also meet Pebble, the small web service this course takes from a first commit to a monitored production system.
Picture a team that has just finished a feature. The developers say it works on their laptops. The operations team, who run the servers, have never seen it, and they are nervous about installing it on a Friday evening because the last release broke the login page for three hours. Nobody is lazy or careless here. The two groups simply have different goals: developers are rewarded for shipping change, operations staff are rewarded for keeping things stable, and change is the most common reason things stop being stable. DevOps is the name for a set of ideas that tries to remove that conflict.
The problem DevOps set out to fix
For a long time, many companies split software work into two departments. Development wrote the code. Operations installed it, kept servers running, handled outages and answered the phone at 3 a.m. Work moved between them as a handover: a ticket, a zip file, a page of installation notes. People sometimes describe this as throwing code "over the wall".
That split creates predictable problems. Releases become rare, because each one is risky and painful, so many changes pile up together. When a big batch fails, it is hard to tell which change caused the problem. The people who wrote the code are not the people who see it fail, so they learn slowly. Operations teams protect themselves with long approval processes and change freezes, which make releases even rarer and bigger. The cycle feeds itself.
The term DevOps came out of this frustration. The first devopsdays conference was held in Ghent, Belgium, in 2009, organized by Patrick Debois, and the name stuck as a shorthand for bringing development and operations together. It was a community movement, not a product or a standard, which is one reason definitions still vary.
What DevOps actually means
AWS describes DevOps as "the combination of cultural philosophies, practices, and tools" that increases an organization's ability to deliver applications and services quickly. That definition is useful because it puts the three parts in the right order.
Culture comes first. Developers and operators share responsibility for the whole life of a service, from the first line of code to how it behaves for real users. When something breaks, the question is "what in our system let this happen?" rather than "who do we blame?" Teams that are afraid of blame hide problems, and hidden problems grow.
Practices turn that culture into habits. The common ones are small, frequent changes; automated testing; continuous integration, where every change is merged and checked often; continuous delivery, where software is always in a releasable state; infrastructure defined as code rather than set up by hand; and monitoring that tells the team how the service behaves in production. You will practice each of these in this course.
Tools support the practices. Git, Docker, a CI system, Terraform, Kubernetes and Prometheus are all tools you will use, but none of them is DevOps by itself. A team can install every tool on the roadmap and still throw code over the wall. A team with good habits and simple tools often delivers more reliably than a team with an expensive toolchain and poor communication.
A simple way to hold the idea: DevOps aims to make changes small, frequent, automated, observable and shared. Small changes are easier to review and undo. Frequent changes keep skills sharp and batches small. Automation removes the error-prone manual steps. Observability tells you quickly whether a change helped or hurt. Shared ownership means the people who build a thing also care how it runs.
DevOps and Agile
Agile software development came earlier. The Manifesto for Agile Software Development, written in 2001, values "individuals and interactions over processes and tools", "working software over comprehensive documentation", "customer collaboration over contract negotiation" and "responding to change over following a plan". Agile methods such as Scrum and Kanban helped teams build software in short cycles with regular feedback from users.
Agile mostly improved how software is planned and written. It did not, on its own, change how software reached production. A team could finish work every two weeks and then wait months for a release window. DevOps extends the short feedback loop past "done in development" to "running in production and observed". The two fit together: Agile shortens the loop between users and developers, and DevOps shortens the loop between a code change and its effect on real users.
The DevOps lifecycle
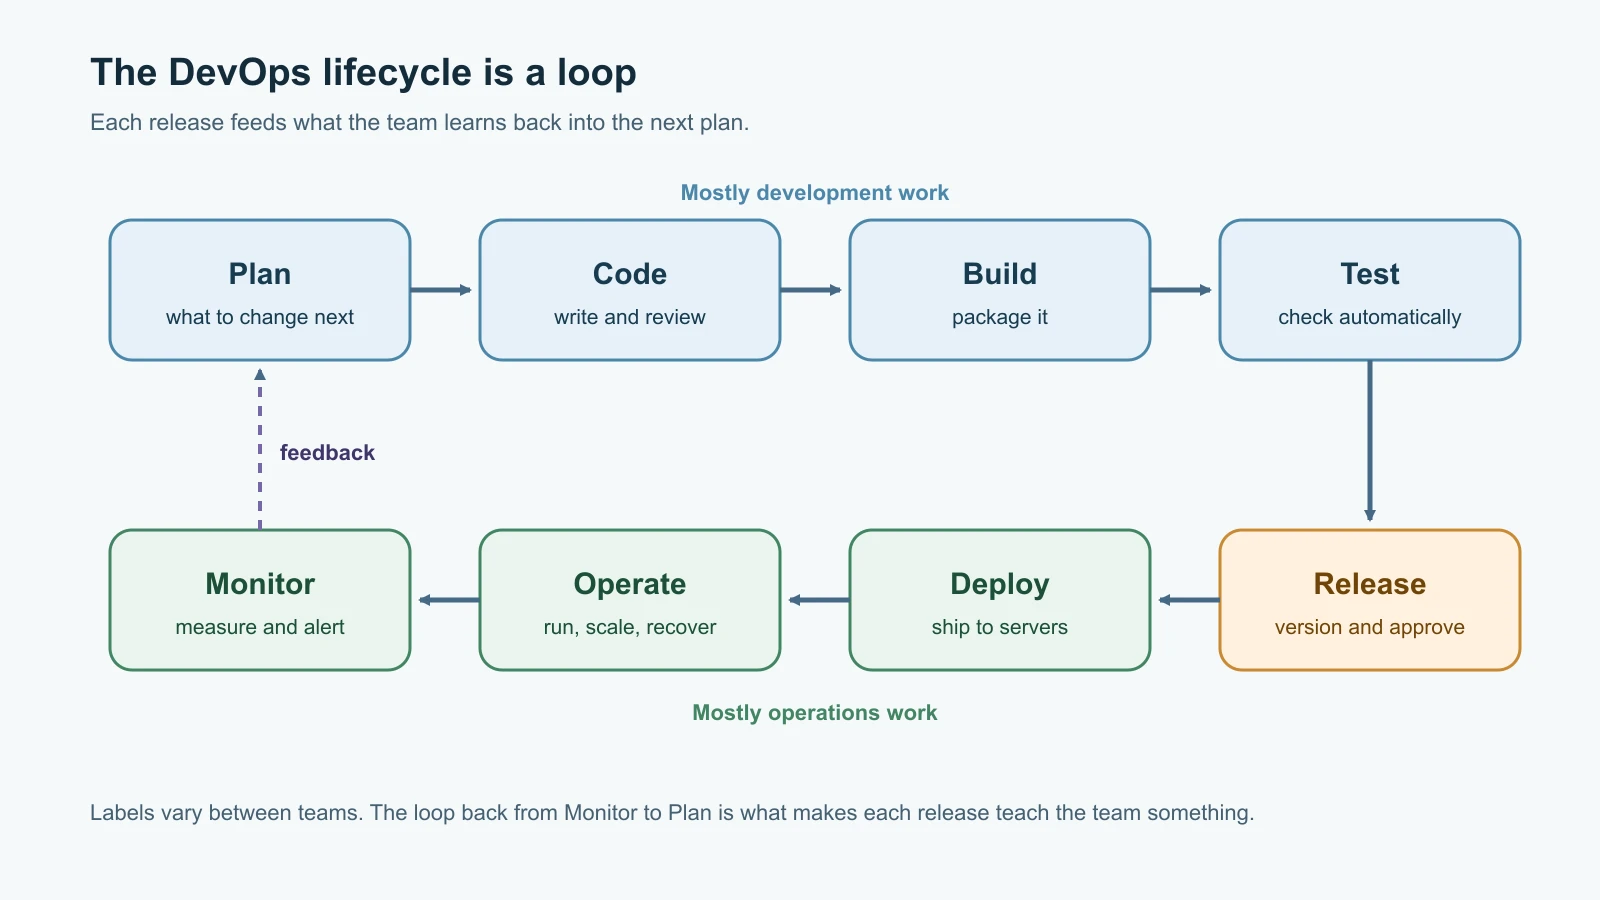
The lifecycle diagram at the top of this lesson shows the work as a loop rather than a straight line, often drawn as a figure of eight. The exact labels vary between companies, but the stages are usually these:
| Stage | What happens | Where this course covers it |
|---|---|---|
| Plan | Decide what to build or fix next, using feedback from users and monitoring | This lesson and Reliability, SLOs and Cloud Design Patterns |
| Code | Write the change and review it with teammates | A Language and a Service to Operate; Git and Collaboration |
| Build | Turn source code into something runnable, such as a container image | Docker for DevOps |
| Test | Check the change automatically before it goes further | Continuous Integration |
| Release | Version the build and approve it for deployment | Continuous Delivery and Deployment Strategies |
| Deploy | Put the release on servers or a cluster, ideally automatically | Terraform, Kubernetes and GitOps lessons |
| Operate | Keep the service running: configuration, scaling, secrets, recovery | Linux, Ansible, Secret Management and Kubernetes lessons |
| Monitor | Measure how the service behaves and alert when it goes wrong | Metrics and Alerting; Logs and Tracing |
The arrow from Monitor back to Plan is the most important part of the picture. Without it, you have a fast conveyor belt that keeps shipping without learning anything. With it, every release teaches the team something about users, performance or reliability, and that knowledge shapes the next change.
DevOps, SRE and platform engineering
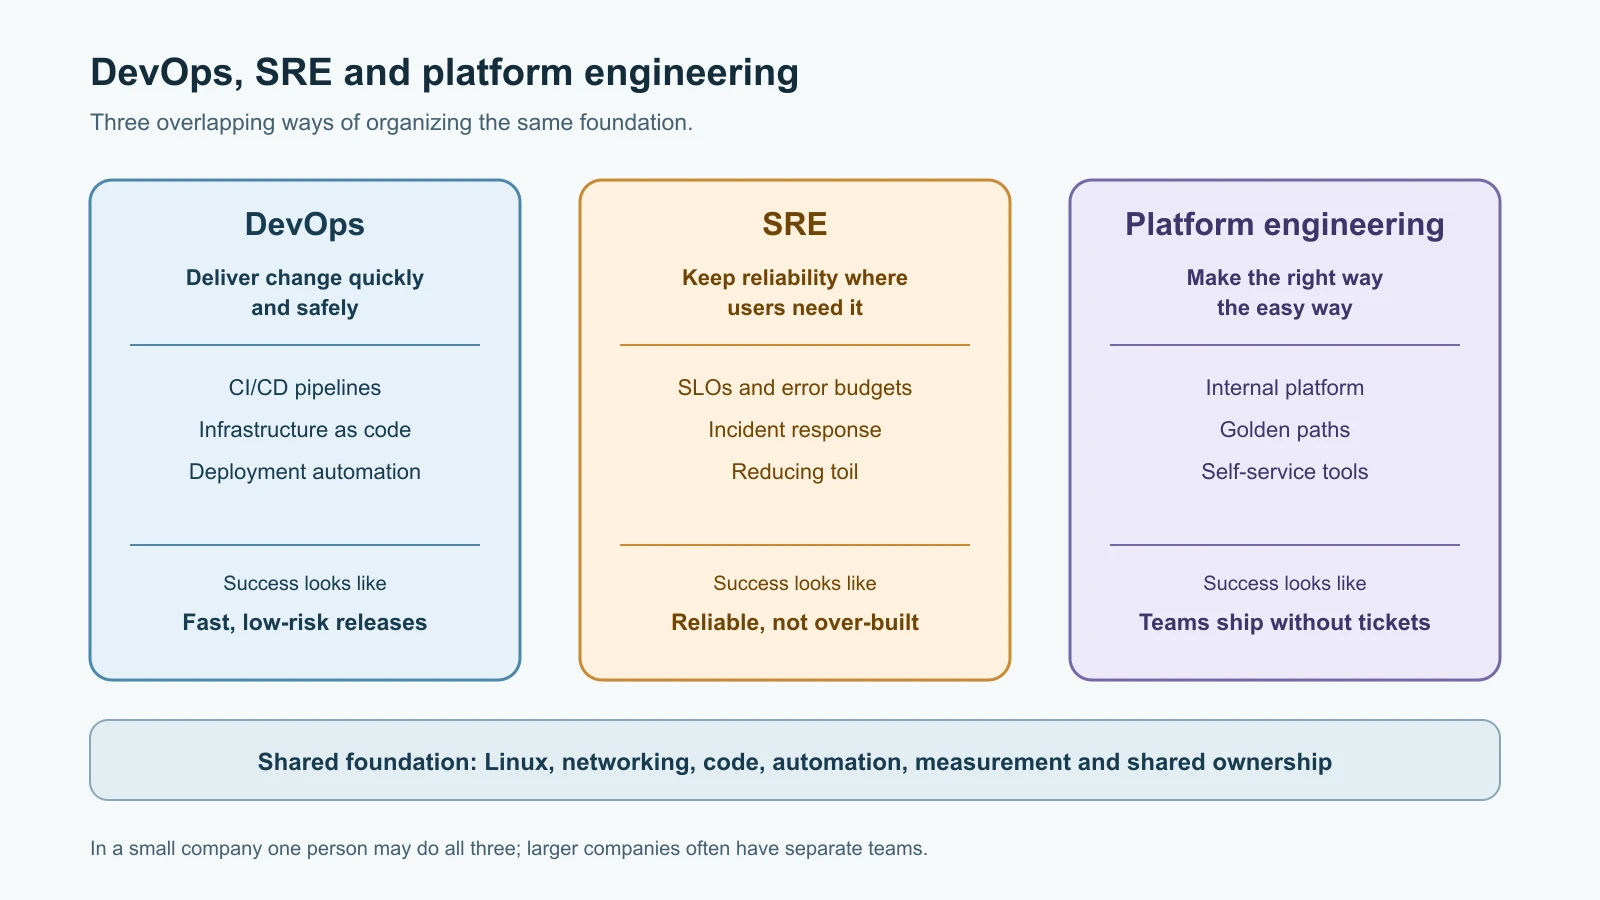
Job adverts use three overlapping names, and beginners often wonder which one to aim for. They are related, but each puts the emphasis in a different place.
DevOps is the broad set of ideas described above. "DevOps engineer" is a common job title, usually meaning someone who builds and maintains the pipelines, infrastructure and tooling that let developers ship and run software. Some people argue DevOps should not be a job title at all, because it describes how a whole organization works. In practice, both meanings exist, and it helps to know which one a team means.
Site reliability engineering (SRE) started at Google. Google's SRE book gives a short definition: SRE is "what happens when you ask a software engineer to design an operations team". SRE teams treat reliability as an engineering problem. They set measurable reliability targets, automate repetitive operations work, and limit manual "toil". The book describes a 50% cap on operational work for SREs, so that at least half their time goes to engineering that reduces future toil. It also introduces the error budget: "one minus the availability target". If a service aims for 99.9% availability, the remaining 0.1% is a budget the team can spend on risky changes. When the budget runs out, the team slows down releases and focuses on reliability. The same book says DevOps and SRE share core principles, and suggests you can see SRE as one specific way of implementing DevOps.
Platform engineering is a newer label. The Cloud Native Computing Foundation's platforms white paper defines a platform as "an integrated collection of capabilities defined and presented according to the needs of the platform's users". A platform team builds an internal product, such as a standard way to create a new service, get a database, deploy and see logs, so that every product team does not have to solve those problems from scratch. The white paper stresses treating the platform "as a product", meaning its users are the company's own developers and their needs drive its design.
| DevOps | SRE | Platform engineering | |
|---|---|---|---|
| Main question | How do we deliver change quickly and safely? | How reliable must this service be, and how do we keep it there? | How do we make the right way the easy way for every team? |
| Typical work | CI/CD pipelines, infrastructure as code, deployment automation | SLOs, error budgets, incident response, reducing toil | Internal developer platforms, golden paths, self-service tooling |
| Success looks like | Fast, low-risk, frequent delivery | Users get the reliability they need, without over-engineering | Product teams ship without waiting on tickets |
In a small company, one person may do all three. In a large one, they are often separate teams. The skills overlap heavily, which is why this course teaches the shared foundation: Linux, networking, code, containers, automation and observability.
Common misconceptions
"DevOps means developers do operations and the ops team goes away." Operations work still exists. It is shared differently and more of it is automated. Teams still need people who understand networks, storage, security and incidents deeply.
"DevOps is a tool you can buy." Vendors sell tools for DevOps practices, but no product changes how two teams work together. If releases still need five approvals and a weekend, a new CI server will not fix that.
"DevOps is just CI/CD." Pipelines are a big part, but monitoring, incident learning, infrastructure, security and team habits matter as much.
"Moving fast means skipping testing and security." The opposite is true. Frequent releases are only safe because of automated tests, reviews, small changes and the ability to roll back. Security checks move earlier into the pipeline so problems are found when they are cheap to fix; you will see this idea, often called "shift left", in Continuous Integration and Secret Management.
"A DevOps engineer doesn't need to code." You will write scripts, configuration and small programs constantly: Bash, Python, YAML pipeline files, Terraform, Dockerfiles. You do not need to be a senior application developer, but you need to read code comfortably and write reliable automation.
Measuring delivery with DORA metrics
If DevOps is meant to make delivery faster and safer, you need a way to tell whether it is working. The most widely used measures come from DORA, a long-running research program on software delivery now run by Google Cloud. DORA's metrics guide (last updated 5 January 2026) describes five software delivery metrics in two groups.
Throughput, how quickly changes move through delivery:
- Change lead time: the time from a change being committed to version control to it being deployed in production.
- Deployment frequency: the number of deployments over a period, or the time between deployments.
- Failed deployment recovery time: the time it takes to recover from a deployment that fails and needs immediate intervention.
Instability, how well deployments go:
- Change fail rate: the share of deployments that need immediate intervention after they go out.
- Deployment rework rate: the share of deployments that are unplanned and happen because of an incident in production.
You may see older articles mention "four key metrics" and "mean time to restore" (MTTR). DORA has since moved to the five-metric model above and replaced MTTR with failed deployment recovery time, which focuses on recovering from a bad change rather than from any outage.
Two cautions matter more than the formulas. First, these are measures of a team's delivery system, not of individual people. If you rank engineers by deployment count, people will split changes artificially and the number stops meaning anything. Second, look at the metrics together. Deploying ten times a day is not an achievement if a third of those deployments break something. Throughput and instability are meant to be read side by side.
Try it: calculate DORA metrics for Pebble
Throughout this course you will work on Pebble, a small URL-shortening web service. Pebble is fictional, made up for this course. It turns long links into short ones and redirects visitors. It has three parts: a small web API, a PostgreSQL database that stores links, and a cache that keeps popular links in memory. Pebble's two-person team currently deploys by logging into a server over SSH and running commands from a text file. Over the next 23 lessons you will replace that with version control, containers, automated pipelines, infrastructure as code, Kubernetes and monitoring, and finish with a capstone that puts it all together.
Before changing anything, a sensible team measures where it is. Pebble keeps a simple log of its deployments for two weeks. Each row records when the change was committed, when it was deployed, whether the deployment failed, when service was recovered after a failure, and whether the deployment was unplanned rework caused by an incident.
Save this as deployments.csv. The data is invented for this lesson:
1committed_at,deployed_at,failed,recovered_at,rework
22026-11-02T09:10:00+00:00,2026-11-02T15:40:00+00:00,no,,no
32026-11-03T11:00:00+00:00,2026-11-04T10:15:00+00:00,yes,2026-11-04T11:05:00+00:00,no
42026-11-04T10:30:00+00:00,2026-11-04T11:00:00+00:00,no,,yes
52026-11-05T14:20:00+00:00,2026-11-06T09:30:00+00:00,no,,no
62026-11-09T08:45:00+00:00,2026-11-09T16:00:00+00:00,no,,no
72026-11-10T13:00:00+00:00,2026-11-11T10:20:00+00:00,yes,2026-11-11T13:50:00+00:00,no
82026-11-11T12:40:00+00:00,2026-11-11T13:35:00+00:00,no,,yes
92026-11-12T09:00:00+00:00,2026-11-12T17:10:00+00:00,no,,no
Every timestamp includes a time zone (+00:00 means UTC). Mixing local times from different machines is a classic way to get negative lead times, so the script refuses timestamps without one.
Save this as dora_metrics.py. It uses only Python's standard library:
1"""Calculate DORA delivery metrics from a CSV of deployments."""
2
3import csv
4import sys
5from datetime import datetime
6from statistics import median
7
8
9def parse_time(text):
10    value = datetime.fromisoformat(text)
11    if value.tzinfo is None:
12        raise ValueError(f"timestamp needs a time zone: {text}")
13    return value
14
15
16def load_deployments(path):
17    with open(path, newline="", encoding="utf-8") as handle:
18        rows = list(csv.DictReader(handle))
19    if not rows:
20        raise ValueError("no deployments in file")
21    deployments = []
22    for row in rows:
23        failed = row["failed"].strip().lower() == "yes"
24        deployments.append({
25            "committed": parse_time(row["committed_at"]),
26            "deployed": parse_time(row["deployed_at"]),
27            "failed": failed,
28            "recovered": parse_time(row["recovered_at"]) if failed else None,
29            "rework": row["rework"].strip().lower() == "yes",
30        })
31    return deployments
32
33
34def hours(delta):
35    return delta.total_seconds() / 3600
36
37
38def dora_metrics(deployments, period_days):
39    total = len(deployments)
40    failures = [d for d in deployments if d["failed"]]
41    recovery = [hours(d["recovered"] - d["deployed"]) for d in failures]
42    return {
43        "deployments_per_week": round(total / period_days * 7, 1),
44        "median_lead_time_hours": round(median(hours(d["deployed"] - d["committed"]) for d in deployments), 1),
45        "change_fail_rate": round(len(failures) / total, 2),
46        "median_recovery_hours": round(median(recovery), 1) if recovery else None,
47        "rework_rate": round(sum(d["rework"] for d in deployments) / total, 2),
48    }
49
50
51def main():
52    if len(sys.argv) != 3:
53        print("usage: python3 dora_metrics.py deployments.csv PERIOD_DAYS")
54        return 2
55    metrics = dora_metrics(load_deployments(sys.argv[1]), int(sys.argv[2]))
56    for name, value in metrics.items():
57        print(f"{name}: {value}")
58    return 0
59
60
61if __name__ == "__main__":
62    sys.exit(main())
A few choices are worth noticing. The script uses the median for lead time and recovery time rather than the average, because one very slow change would drag an average up and hide what usually happens. Recovery time is measured from the failed deployment to recovery, matching DORA's definition. Rates are fractions between 0 and 1, so 0.25 means one deployment in four. If there were no failures, recovery time is None rather than zero, because "no data" is different from "recovered instantly".
Run it for the 14-day period with Python 3.9 or newer:
1python3 dora_metrics.py deployments.csv 14On Python 3.12 it prints:
1deployments_per_week: 4.0
2median_lead_time_hours: 7.7
3change_fail_rate: 0.25
4median_recovery_hours: 2.2
5rework_rate: 0.25
Read the result as a team would. Pebble deploys about four times a week, and a typical change reaches production within a working day. But one deployment in four fails, and another one in four is unplanned rework after an incident. That instability is the real problem, and it points to missing automated tests and a risky manual deployment process. Several lessons in this course target exactly that.
Test the script
Save this as dora_metrics_test.py in the same folder:
1import tempfile
2import unittest
3from datetime import datetime, timedelta, timezone
4from pathlib import Path
5
6from dora_metrics import dora_metrics, load_deployments
7
8START = datetime(2026, 11, 2, 9, 0, tzinfo=timezone.utc)
9
10
11def deploy(lead_hours, failed=False, recovery_hours=None, rework=False):
12    deployed = START + timedelta(hours=lead_hours)
13    recovered = deployed + timedelta(hours=recovery_hours) if failed else None
14    return {"committed": START, "deployed": deployed, "failed": failed,
15            "recovered": recovered, "rework": rework}
16
17
18class DoraMetricsTest(unittest.TestCase):
19    def test_counts_and_rates(self):
20        result = dora_metrics([deploy(2), deploy(4, failed=True, recovery_hours=1),
21                               deploy(6, rework=True), deploy(8)], period_days=14)
22        self.assertEqual(result["deployments_per_week"], 2.0)
23        self.assertEqual(result["median_lead_time_hours"], 5.0)
24        self.assertEqual(result["change_fail_rate"], 0.25)
25        self.assertEqual(result["median_recovery_hours"], 1.0)
26        self.assertEqual(result["rework_rate"], 0.25)
27
28    def test_no_failures_means_no_recovery_time(self):
29        result = dora_metrics([deploy(1), deploy(3)], period_days=7)
30        self.assertIsNone(result["median_recovery_hours"])
31        self.assertEqual(result["change_fail_rate"], 0.0)
32
33    def test_rejects_timestamps_without_time_zone(self):
34        with tempfile.TemporaryDirectory() as folder:
35            path = Path(folder) / "deploys.csv"
36            path.write_text("committed_at,deployed_at,failed,recovered_at,rework\n"
37                            "2026-11-02T09:00:00,2026-11-02T10:00:00,no,,no\n")
38            with self.assertRaises(ValueError):
39                load_deployments(path)
40
41    def test_recovery_only_read_for_failed_deploys(self):
42        with tempfile.TemporaryDirectory() as folder:
43            path = Path(folder) / "deploys.csv"
44            path.write_text("committed_at,deployed_at,failed,recovered_at,rework\n"
45                            "2026-11-02T09:00:00+00:00,2026-11-02T10:00:00+00:00,YES,2026-11-02T10:30:00+00:00,no\n"
46                            "2026-11-02T11:00:00+00:00,2026-11-02T12:00:00+00:00,no,,yes\n")
47            rows = load_deployments(path)
48            self.assertTrue(rows[0]["failed"])
49            self.assertIsNone(rows[1]["recovered"])
50            self.assertTrue(rows[1]["rework"])
51
52    def test_empty_file_is_an_error(self):
53        with tempfile.TemporaryDirectory() as folder:
54            path = Path(folder) / "deploys.csv"
55            path.write_text("committed_at,deployed_at,failed,recovered_at,rework\n")
56            with self.assertRaises(ValueError):
57                load_deployments(path)
58
59
60if __name__ == "__main__":
61    unittest.main()
Run the tests:
1python3 -m unittest -v dora_metrics_testAll five tests pass. The first test uses four deployments with lead times of 2, 4, 6 and 8 hours, so you can check the expected median of 5 hours in your head. The others cover the edge cases that most often break this kind of report: a period with no failures, timestamps without a time zone, mixed upper and lower case in the failed column, and an empty file. In Continuous Integration you will make a pipeline run tests like these on every change, so nobody has to remember to.
Skills you will build
A working DevOps engineer draws on a wide but connected set of skills. This course builds them in an order where each one supports the next:
- Code and scripting: Python for small services and tools, Bash for automating the terminal.
- Linux and networking: how servers run processes, store files, and talk to each other over DNS, HTTP, TLS and SSH.
- Version control: Git, pull requests and branching, so every change is tracked and reviewed.
- Containers and cloud: packaging Pebble with Docker and understanding what AWS, Azure and Google Cloud provide.
- Automation: infrastructure as code with Terraform, configuration with Ansible, and CI/CD pipelines.
- Orchestration: running containers on Kubernetes and deploying them with GitOps.
- Observability and reliability: metrics, logs, traces, alerts, SLOs and learning from incidents.
- Communication: writing runbooks, postmortems and clear change notes. This is easy to underrate and hard to replace.
You do not need to master each tool before moving on. The goal is to understand what each one is for, use it on Pebble, and know where to go deeper. If you later work on machine learning systems, the What Is MLOps? lesson shows how these same practices are applied to models.
Mistakes beginners make
- Treating DevOps as a list of tools to install rather than a way of working.
- Learning Kubernetes before Linux, networking and Git, then struggling with every error message.
- Thinking "DevOps engineer" means "the person who does deployments", which recreates the wall DevOps was meant to remove.
- Chasing deployment frequency while ignoring change fail rate, so the team ships faster but breaks more.
- Using DORA metrics to rank individuals, which encourages gaming the numbers.
- Mixing time zones in delivery data and getting meaningless lead times.
- Assuming SRE and DevOps are rivals, when the SRE book itself describes them as sharing core principles.
- Blaming a person after an incident instead of asking what in the system allowed the mistake.
Recap and try it yourself
DevOps is a combination of culture, practices and tools that helps teams deliver change quickly and safely. It grew out of the gap between development and operations, and the community took its name from devopsdays in 2009. It extends Agile's short feedback loop all the way to production. The lifecycle runs from plan to monitor and back again, and the loop back from monitoring is what makes teams improve. SRE applies software engineering to reliability, with error budgets and limits on toil, while platform engineering builds internal products that make the right way easy. DORA's five metrics, change lead time, deployment frequency, failed deployment recovery time, change fail rate and deployment rework rate, measure a team's delivery system and should be read together.
Try it yourself:
- Run
dora_metrics.pyand its tests on your machine. Then add two more rows todeployments.csv: one quick successful deployment and one failed deployment that took four hours to recover. Predict the new change fail rate and median recovery time before you run the script again. - Change the period from 14 to 7 days and explain why deployments per week doubles while the other metrics stay the same.
- Think of a team you have worked in, or a project of your own. Write one sentence for each lifecycle stage describing how it happens today, and circle the stage that is slowest or most manual. Keep this note: by the end of the course you will have practiced a better way to run that stage.
Sources checked on 13 November 2026: AWS, What is DevOps?; devopsdays, About; Manifesto for Agile Software Development; Google SRE book, Introduction; CNCF TAG App Delivery, Platforms white paper; DORA, software delivery performance metrics; and the roadmap.sh DevOps roadmap. Pebble, its team and its deployment log are fictional.