
DevOps course · lesson 24 of 24
- 1What Is DevOps?
- 2A Language and a Service to Operate
- 3Linux and the Terminal
- 4Bash Scripting for Ops
- 5Git and Collaboration
- 6Networking for DevOps
- 7Web Servers, Proxies and Load Balancers
- 8Docker for DevOps
- 9Docker Compose and Multi-Service Apps
- 10Cloud Providers: AWS, Azure and Google Cloud
- 11Serverless Functions and Platforms
- 12Terraform and Infrastructure as Code
- 13Ansible and Configuration Management
- 14Continuous Integration with GitHub Actions and GitLab CI
- 15Continuous Delivery and Deployment Strategies
- 16Secret Management
- 17Kubernetes Basics
- 18Kubernetes in Practice
- 19GitOps with Argo CD and Flux
- 20Service Mesh: Istio, Linkerd, Consul and Envoy
- 21Metrics and Alerting with Prometheus and Grafana
- 22Logs and Tracing with Loki, Elastic and OpenTelemetry
- 23Reliability, SLOs and Cloud Design Patterns
- 24Capstone: Pebble to Production
After this lesson, you will be able to take one service from a commit to monitored production using every practice in this course, prove each deployment with an automated smoke test, plan and run a game day that tests your alerts, runbook and team, write a blameless postmortem from what you observed, explain honestly what your setup does not yet cover, and present the whole project in a DevOps interview. It is the last lesson of the course, and it adds very little new technology on purpose. The work now is joining the pieces and showing that they hold together.
Pebble started in A Language and a Service to Operate as one Python file with a SQLite database. Since then it has gained a systemd service, scripts, a Git workflow, a reverse proxy, a container image, PostgreSQL and a cache, cloud servers, a serverless uptime checker, Terraform, Ansible, CI and CD pipelines, secrets handling, Kubernetes manifests and a Helm chart, GitOps, a mesh experiment, metrics, logs, traces and SLOs. Each lesson built one piece in isolation. Real systems fail at the joins: an image tag that never reaches the cluster, an alert that points at the wrong target, a runbook written for last year's setup. The capstone is where you find those gaps yourself, before an interviewer or an outage finds them for you.
The whole path at a glance
The table is your checklist. Each row is a stage of delivery, the artifact you should already have and the lesson where you built it. Work through it in order and do not move on until the "done when" condition is true on your own machine or account.
| Stage | What you should have | Done when | Built in |
|---|---|---|---|
| Code | Pebble 0.3.0 with its unit tests | python3 -m unittest -v passes | A Language and a Service to Operate, Docker Compose and Multi-Service Apps |
| Operations scripts | Health check, backup and restore drill | Their test scripts pass and ShellCheck is clean | Bash Scripting for Ops, Reliability, SLOs and Cloud Design Patterns |
| Source control | A repository with protected main and pull requests | A direct push to main is refused | Git and Collaboration |
| Serving | Nginx in front of two app replicas | Requests alternate between replicas; rate limit returns 429 | Web Servers, Proxies and Load Balancers |
| Container | A small, non-root image with a version tag | Builds, runs and scans with no critical findings you have not reviewed | Docker for DevOps |
| Local stack | Compose with proxy, app, PostgreSQL and Valkey | docker compose ps shows every service healthy | Docker Compose and Multi-Service Apps |
| Continuous integration | Tests, lint and ShellCheck on every pull request | A failing test blocks a merge | Continuous Integration with GitHub Actions and GitLab CI |
| Delivery | Build once, promote the same artifact | The image digest in staging equals the one in production | Continuous Delivery and Deployment Strategies |
| Infrastructure | Terraform with remote state; Ansible for configuration | terraform plan shows no changes after apply | Terraform and Infrastructure as Code, Ansible and Configuration Management |
| Secrets | No secret in Git, images or logs | A secret scan of the repository is clean | Secret Management |
| Kubernetes | Deployment, Service, probes, resources, Helm chart | kubectl get pods shows ready Pods; probes pass | Kubernetes Basics, Kubernetes in Practice |
| GitOps | Argo CD syncing from a separate configuration repository | A commit to the config repository changes the cluster | GitOps with Argo CD and Flux |
| Observability | Probe, dashboard, logs and traces | Grafana shows the probe; Loki shows app logs | Metrics and Alerting with Prometheus and Grafana, Logs and Tracing with Loki, Elastic and OpenTelemetry |
| Reliability | SLO, burn-rate alerts, runbook, restore drill | promtool test rules passes; the drill passes | Reliability, SLOs and Cloud Design Patterns |
Two optional stages sit outside the main path. The serverless uptime checker from Serverless Functions and Platforms gives you a second, external view of availability, and the service mesh canary from Service Mesh: Istio, Linkerd, Consul and Envoy is worth repeating if you want a progressive-delivery story. Leave both out on a small laptop; mention them as next steps instead.
Two repositories, one direction of change
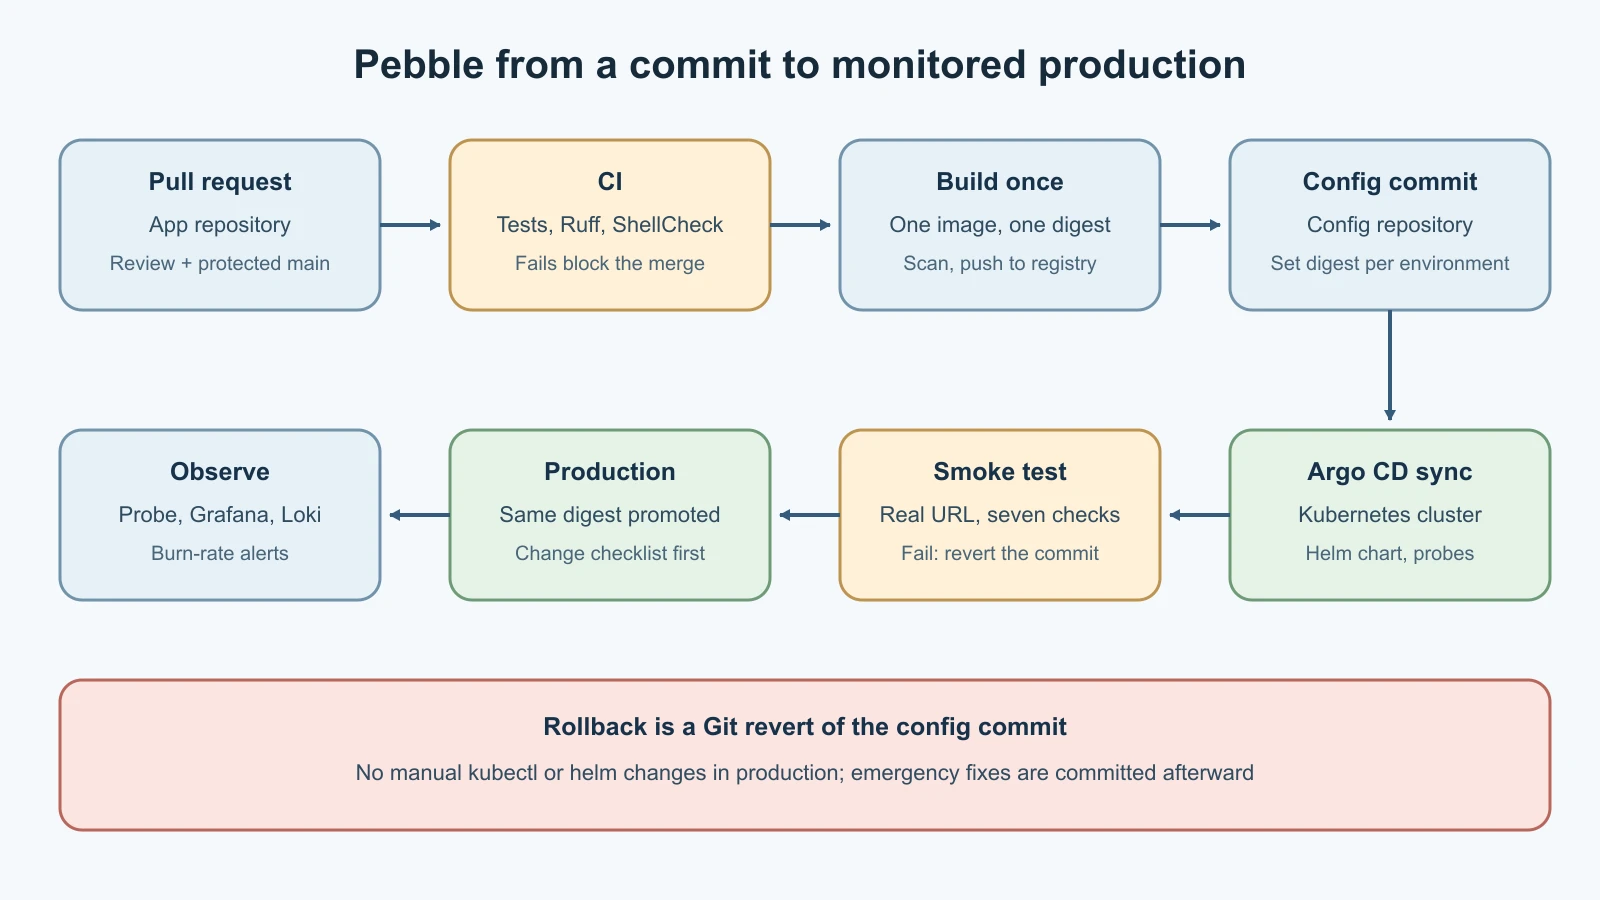
Keep the structure from the GitOps lesson: an application repository with Pebble's code, tests, Dockerfile, CI workflow and scripts, and a configuration repository with the Helm values or manifests that describe what runs in each environment. A change flows in one direction only:
- A developer opens a pull request in the application repository. CI runs the tests, Ruff and ShellCheck.
- After review and merge, the pipeline builds one image, tags it with the version and commit, scans it and pushes it to the registry.
- A small commit to the configuration repository changes the image tag, or better, the digest, for staging.
- Argo CD notices the commit and syncs the cluster. The smoke test runs against staging.
- Promotion to production is another configuration commit with the same digest, after the smoke test passes and the change checklist from the reliability lesson is filled in.
- Probes, dashboards and burn-rate alerts watch the result. Rolling back is a revert of the configuration commit.
Nobody runs kubectl apply or helm upgrade against production by hand. If an emergency forces a manual change, the incident log records it and someone commits the same change to the configuration repository afterward, so Argo CD does not quietly undo it.
Prove every deployment with a smoke test
Unit tests prove the code works on a developer's machine. A smoke test proves a deployed copy works where users reach it: through the real proxy, with the real database and cache. It is short, fast and safe to run against production after every deployment. Pebble's smoke test checks the paths a user depends on: liveness, readiness, creating a link, the redirect, the lookup API, and that bad input is still rejected. Save it as pebble-smoke.sh in the application repository:
1#!/usr/bin/env bash
2# Smoke-test a running Pebble: health, readiness, create, redirect, lookup and validation.
3set -euo pipefail
4
5base_url="${1:-}"
6[[ -n "$base_url" ]] || { echo "usage: pebble-smoke.sh BASE_URL" >&2; exit 2; }
7base_url="${base_url%/}"
8target="https://example.com/smoke-$(date -u +%Y%m%dT%H%M%SZ)"
9failures=0
10
11body=$(mktemp)
12trap 'rm -f "$body"' EXIT
13
14check() {  # check NAME EXPECTED ACTUAL
15  if [[ "$2" == "$3" ]]; then
16    echo "PASS $1"
17  else
18    echo "FAIL $1: expected $2, got $3"
19    failures=$((failures + 1))
20  fi
21}
22
23request() {  # request METHOD PATH [JSON]; prints the status code, saves the body
24  local args=(-sS -o "$body" -w '%{http_code}' --max-time 5 -X "$1")
25  if [[ -n "${3:-}" ]]; then
26    args+=(-H 'Content-Type: application/json' --data "$3")
27  fi
28  curl "${args[@]}" "$base_url$2" 2> /dev/null || true
29}
30
31field() {  # field NAME; prints one field of the saved JSON body
32  python3 -c 'import json, sys; print(json.load(sys.stdin).get(sys.argv[1], ""))' "$1" < "$body" 2> /dev/null || true
33}
34
35check "healthz" 200 "$(request GET /healthz)"
36check "readyz" 200 "$(request GET /readyz)"
37check "create link" 201 "$(request POST /api/links "{\"url\": \"$target\"}")"
38code=$(field code)
39if [[ -n "$code" ]]; then
40  redirect=$(curl -sS -o /dev/null -w '%{http_code} %{redirect_url}' --max-time 5 "$base_url/$code" 2> /dev/null || true)
41  check "redirect" "302 $target" "$redirect"
42  check "lookup status" 200 "$(request GET "/api/links/$code")"
43  check "lookup url" "$target" "$(field url)"
44else
45  check "short code returned" "a code" "nothing"
46fi
47check "reject invalid url" 400 "$(request POST /api/links '{"url": "not-a-url"}')"
48
49if (( failures > 0 )); then
50  echo "FAILED: $failures check(s) failed against $base_url"
51  exit 1
52fi
53echo "OK: all checks passed against $base_url"
A few design choices are worth noticing. Every check runs even after one fails, so a single run shows the whole picture instead of stopping at the first error. curl --max-time 5 stops a hung server from hanging the pipeline. The script prints 000 as the status when it cannot connect at all, which is what curl reports. Each run creates one link with a timestamped smoke- target, so smoke-test data is easy to recognize and exclude from reports. In a busier service you would give the smoke test its own test account or a cleanup step; for Pebble, one small row per deployment is an acceptable cost. Exit code 0 means every check passed, 1 means at least one failed and 2 means the script was called wrongly, so pipelines and people can tell the cases apart.
Start Pebble locally with PEBBLE_PORT=8080 python3 pebble.py and run the smoke test from another terminal:
1./pebble-smoke.sh http://localhost:8080
2echo "exit code: $?"1PASS healthz
2PASS readyz
3PASS create link
4PASS redirect
5PASS lookup status
6PASS lookup url
7PASS reject invalid url
8OK: all checks passed against http://localhost:8080
9exit code: 0Stop Pebble and run it again:
1FAIL healthz: expected 200, got 000
2FAIL readyz: expected 200, got 000
3FAIL create link: expected 201, got 000
4FAIL short code returned: expected a code, got nothing
5FAIL reject invalid url: expected 400, got 000
6FAILED: 5 check(s) failed against http://localhost:8080
7exit code: 1
The test script starts a real Pebble on a free port with a temporary database, runs the smoke test against it, stops it and runs again, then points the smoke test at a plain file server that answers /healthz but is not Pebble. Save it as test-pebble-smoke.sh next to pebble.py:
1#!/usr/bin/env bash
2# Run pebble-smoke.sh against a real Pebble, a stopped Pebble and a server that is not Pebble.
3set -uo pipefail
4cd "$(dirname "$0")" || exit 1
5tmp=$(mktemp -d)
6pids=()
7cleanup() { kill "${pids[@]}" 2> /dev/null; rm -r "$tmp"; }
8trap cleanup EXIT
9failures=0
10
11check() {  # check NAME EXPECTED ACTUAL
12  if [[ "$2" == "$3" ]]; then echo "ok   $1"; else echo "FAIL $1: expected '$2', got '$3'"; failures=$((failures + 1)); fi
13}
14
15free_port() { python3 -c 'import socket; s = socket.socket(); s.bind(("127.0.0.1", 0)); print(s.getsockname()[1])'; }
16
17wait_for() {  # wait_for URL; up to five seconds
18  for _ in $(seq 50); do curl -s -o /dev/null "$1" && return 0; sleep 0.1; done
19  return 1
20}
21
22port=$(free_port)
23PEBBLE_PORT=$port PEBBLE_DB_PATH="$tmp/pebble.db" python3 pebble.py > "$tmp/pebble.log" 2>&1 &
24pids+=($!)
25wait_for "http://127.0.0.1:$port/healthz" || { echo "Pebble did not start"; exit 1; }
26
27out=$(./pebble-smoke.sh "http://127.0.0.1:$port/")
28check "passes against a healthy Pebble" 0 $?
29check "runs all seven checks" 7 "$(grep -c '^PASS' <<< "$out")"
30
31kill "${pids[0]}"; wait "${pids[0]}" 2> /dev/null
32out=$(./pebble-smoke.sh "http://127.0.0.1:$port")
33check "fails when Pebble is stopped" 1 $?
34check "reports the failed health check" 1 "$(grep -c '^FAIL healthz' <<< "$out")"
35
36other=$(free_port)
37mkdir "$tmp/www" && echo ok > "$tmp/www/healthz"
38python3 -m http.server "$other" --bind 127.0.0.1 --directory "$tmp/www" > /dev/null 2>&1 &
39pids+=($!)
40wait_for "http://127.0.0.1:$other/healthz" || { echo "test server did not start"; exit 1; }
41out=$(./pebble-smoke.sh "http://127.0.0.1:$other")
42check "fails against a server that is not Pebble" 1 $?
43check "still reports the passing health check" 1 "$(grep -c '^PASS healthz' <<< "$out")"
44
45./pebble-smoke.sh > /dev/null 2>&1
46check "needs a base URL" 2 $?
47
48if (( failures > 0 )); then echo "$failures check(s) failed"; exit 1; fi
49echo "all checks passed"
All seven checks pass and ShellCheck reports nothing. Breaking the script on purpose, by ignoring the failure count, accepting any non-empty status, comparing against the wrong expected status, returning success on a usage error, not counting failures, or expecting the wrong redirect target, makes the tests fail every time.
Run the smoke test in three places. In CI, after the image is built, start it with Compose and run the smoke test against the proxy, which catches broken images before they reach a registry. After every deployment, run it against the environment's public URL; in a GitOps setup this can be an Argo CD PostSync hook Job or a pipeline step that waits for the sync to finish. And during incidents, run it by hand: it answers "what still works?" in two seconds.
Run a game day
A game day is a planned exercise in which the team causes a realistic failure on purpose and watches how the system and the people respond. It tests what diagrams cannot: whether the alert fires, whether it reaches someone, whether the runbook still matches the system, and whether the team knows who does what. Chaos engineering tools such as Chaos Mesh, LitmusChaos and AWS Fault Injection Service automate this kind of fault at scale; a first game day needs only a plan and a stopwatch.
Run Pebble's first game day on the local Compose stack with the observability lab and the SLO rules attached, never on a shared or production system. Write the plan before you start:
1Game day plan: database outage
2Hypothesis: if PostgreSQL stops, /readyz returns 503, the external probe fails,
3  PebbleErrorBudgetFastBurn fires within about ten minutes, and following the
4  runbook restores service within five minutes of the page.
5Scope: local Compose stack only. Abort if anything outside the lab is affected.
6Roles: incident commander <name>; operations <name>; observer and timekeeper <name>.
7Steps: record start time -> docker compose stop db -> observe -> follow the runbook.
8Success: alert fires; runbook leads to the fix; smoke test passes after recovery.
9Rollback: docker compose start db
Then run it:
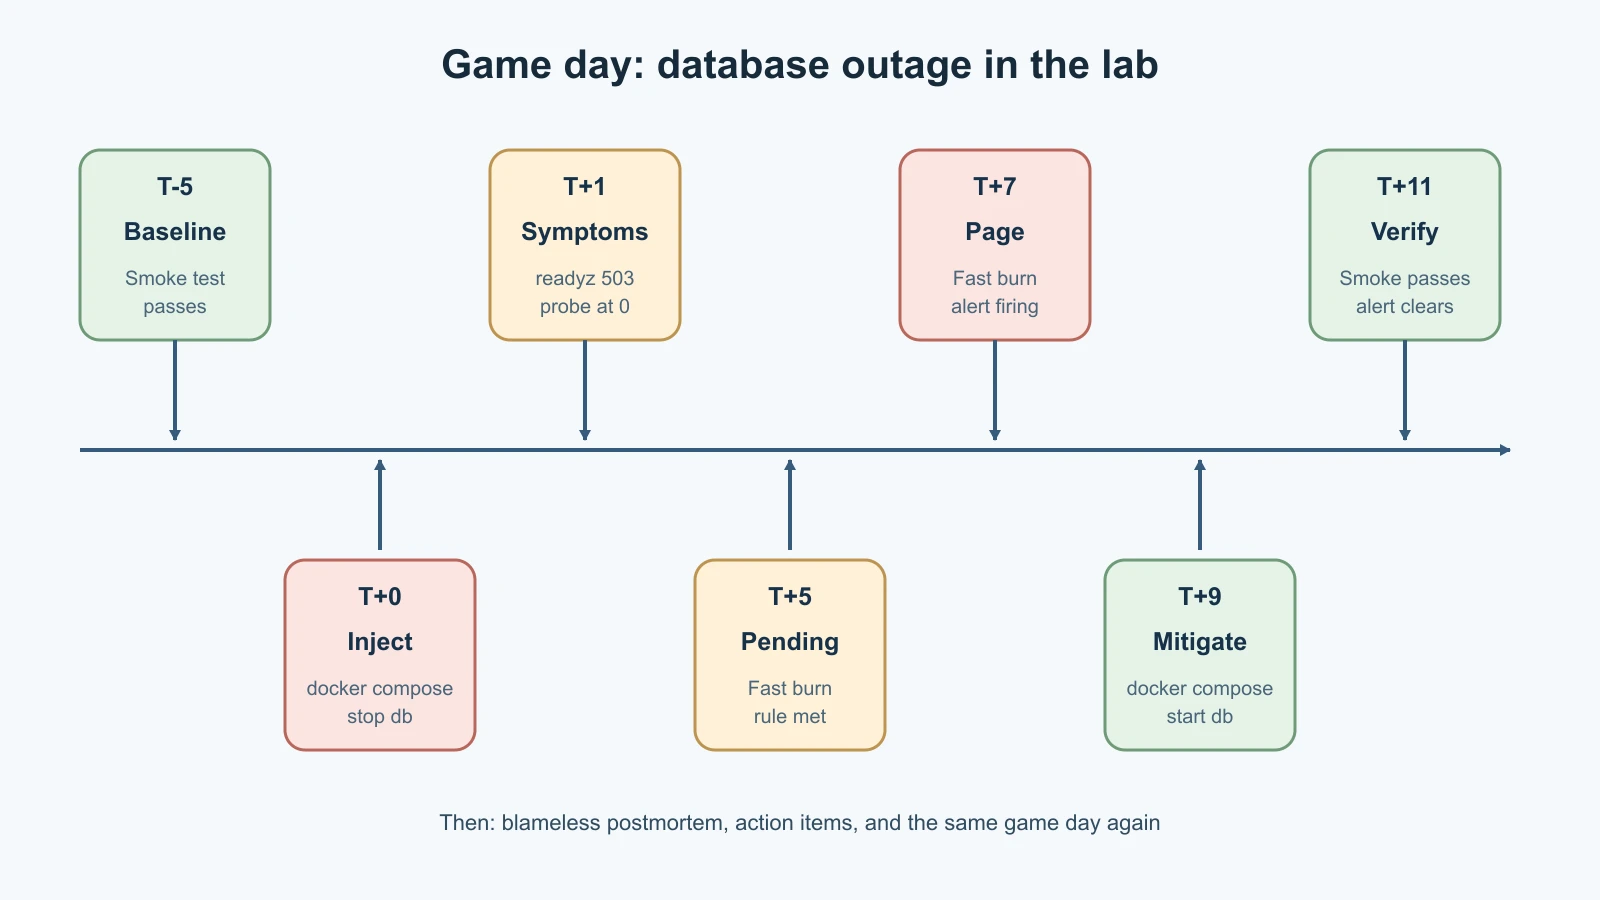
- Confirm the starting state.
./pebble-smoke.sh http://localhost:8080passes, Prometheus athttp://localhost:9090/targetsshows the probeUP, and the Alerts page athttp://localhost:9090/alertsshows the burn-rate rules as inactive. - Note the time and inject the fault from the Pebble directory with
docker compose stop db. - Watch without fixing. Within a few health-check intervals
curl http://localhost:8080/readyzreturns503,probe_successdrops to 0 in Grafana and the smoke test showsreadyzandcreate linkfailing whilehealthzstill passes, which is the liveness and readiness split working as designed. - Record when
PebbleErrorBudgetFastBurnmoves to pending and then firing. With a 15-second scrape interval it needs about four and a half minutes of failures before the one-hour error ratio crosses 7.2% (14.4 × 0.005), plus its two-minutefordelay. - When it fires, the operations lead follows the runbook from the reliability lesson exactly as written, and the observer notes every step that was unclear, wrong or missing.
- Mitigate with
docker compose start db. Confirm with the smoke test, then watch the alert return to inactive. - Stop the clock and hold a short debrief while memories are fresh.
The game day often teaches more through its surprises than its successes. Perhaps the runbook says to check kubectl get pods, but the lab runs on Compose. Perhaps nobody knew where the Grafana password was. Perhaps the alert fired but nothing routed it to a person, because the lab has no Alertmanager. Each surprise is a finding, and findings belong in the postmortem.
Write the postmortem
Use the template from the reliability lesson even though the outage was planned; practicing the format is part of the exercise. An example of how the result might read, with times relative to the start:
1Postmortem: Game day 1, PostgreSQL stopped              Status: reviewed
2Duration: T+0 to T+11 minutes (planned exercise, local lab only)
3Impact: in the lab, link creation and lookups failed; /healthz stayed up.
4  Error budget used (lab SLO): about 5%.
5Detection: PebbleErrorBudgetFastBurn fired at T+7. Time to detect: 7 minutes.
6Timeline: T+0 db stopped. T+1 readyz 503, probe 0. T+5 alert pending.
7  T+7 alert firing. T+8 runbook step 4 identifies the database. T+9 db started.
8  T+10 smoke test passes. T+11 alert inactive.
9Contributing causes: single PostgreSQL instance with no standby; the runbook
10  checked Kubernetes before Compose; no route from alerts to a person in the lab.
11What went well: readiness and liveness split; alert fired as the unit test predicted.
12What was hard: the runbook's first command did not apply to the lab.
13Action items:
14  Add a Compose branch to runbook step 4 | <owner> | P2 | <date> | <ticket>
15  Add Alertmanager with an email receiver to the lab | <owner> | P2 | <date> | <ticket>
16  Write a DR note on adding a PostgreSQL standby | <owner> | P3 | <date> | <ticket>
Your own timeline will differ; record what you actually saw. Then do the action items, and run the same game day again. A second run that is faster and calmer is the evidence that the loop works.
Make the project presentable
A capstone that only runs on your laptop is hard to show anyone. Turn it into a portfolio project:
- A
README.mdin the application repository with a one-paragraph description, an architecture diagram, how to run it locally in three commands, and links to the configuration repository and the pipeline runs. - The pipeline status badge and a green run history, so a reader can see CI working without cloning anything.
- A
docs/folder with the SLO sheet, runbook, disaster recovery plan and the game-day postmortem. - A short "decisions" section explaining why you chose each tool and what you would change at a larger scale, such as PostgreSQL with a standby, a managed Kubernetes service or Alertmanager routing to an on-call rotation.
- Screenshots of the Grafana dashboard during the game day, the Argo CD application tree and the failing-then-passing smoke test.
Keep secrets, account IDs and personal data out of everything you publish, including screenshots and Terraform state. The secret-scanning step from the secrets lesson should run on this repository too.
What this capstone does not cover
Be honest about limits; interviewers trust candidates who know where their system stops. This project deliberately leaves out:
- High availability of data. Pebble runs one PostgreSQL instance. Production would use a managed database with a standby or replicas, automated backups and point-in-time recovery, and the restore drill would restore into that.
- Real multi-zone or multi-region resilience. A kind cluster is several containers on one machine. The ideas carry over to a managed cluster across availability zones, but the failure modes and costs are different.
- Request-level metrics. Pebble has no
/metricsendpoint, so its SLI comes from probes. Adding Prometheus client metrics for request counts and latency would allow a request-based SLO and the four golden signals. - Alert routing and on-call. The lab shows alerts in Prometheus. A real team routes them through Alertmanager or a paging service to a rotation with escalation.
- Supply chain security. Image signing, software bills of materials, provenance attestations and admission policies that only allow signed images are the next layer after scanning.
- Cost management. The course mentions budgets and cleanup, but a production service needs cost allocation tags, alerts on spend and regular reviews.
- Compliance and data protection. Audit trails, retention rules and privacy requirements depend on the business and the country.
None of these gaps is a failure. Each is a sensible next step, and naming them shows you understand the difference between a learning environment and production.
Where to go next
Choose depth in one direction rather than breadth in all of them:
- Platform engineering: build an internal developer platform that gives other teams Pebble-style pipelines and environments through templates and self-service.
- Kubernetes depth: operators and custom resources, network policies, autoscaling on custom metrics, and the Cloud Native Computing Foundation's Kubernetes certifications if a credential matters for your job search.
- One cloud in depth: pick the provider your target employers use and learn its networking, identity, managed databases and cost tools well.
- Security: the Cyber Security course on this site goes deeper into threats, defenses and incident response, which pairs naturally with DevSecOps work.
- Reliability: read the free Google SRE book and workbook in full, and practice writing SLOs for services you use every day.
Interview preparation checklist
DevOps interviews usually mix fundamentals, scenario questions and a discussion of something you built. Use this checklist in the weeks before:
- Explain DevOps in two minutes: culture, automation, measurement and sharing, the DORA metrics, and how SRE and platform engineering relate. Practice out loud.
- Linux and networking fundamentals: permissions, processes, systemd, logs, DNS resolution, TLS, what happens when you type a URL, and how you would debug "the site is slow".
- Write a script live: a short Bash or Python script that reads a log and counts errors, with exit codes and quoting done right.
- Containers and Kubernetes: image layers, why containers run as non-root, Deployments versus StatefulSets, readiness versus liveness probes, requests versus limits, and how a Service finds Pods.
- CI/CD and GitOps: build once and promote, deployment strategies and when to use each, rollback versus roll forward, and why GitOps uses a separate configuration repository.
- Infrastructure as code: what Terraform state is and why it needs locking, how to handle drift, and when to use configuration management instead.
- Observability and reliability: metrics, logs and traces with an example of each; SLI, SLO and error budget in your own words; burn-rate alerting; a blameless postmortem.
- Security basics: where secrets leak, least privilege, workload identity, image scanning and secret scanning.
- Tell the capstone story using situation, task, action and result: what you built, one hard problem and how you solved it, what the game day revealed, what you would change next. Keep it under three minutes and have the repository open.
- Prepare questions for them: how they deploy, how often, how they measure reliability, what their on-call looks like and what happened in their last incident.
Expect at least one scenario question, such as "a deployment just went out and error rates doubled; what do you do?" A strong answer follows the order from this course: mitigate first by rolling back, communicate, confirm recovery with data, then investigate and write it up.
Mistakes beginners make
- Building every piece separately and never testing the joins between them.
- Deploying to production by hand "just this once" and letting the configuration repository drift.
- Treating a passing unit test suite as proof that a deployment works, without a smoke test.
- Running a first game day on a shared or production environment.
- Fixing the fault during a game day before the alert and runbook have been tested.
- Writing a postmortem for a game day that hides the awkward parts.
- Publishing a portfolio repository with secrets, account IDs or Terraform state in it.
- Claiming a capstone is "production-grade" in an interview instead of explaining its limits.
- Learning a little of every tool on a job ad instead of explaining one working system well.
Recap and try it yourself
The capstone joins the course into one system: code and tests, scripts, Git, a proxy, a container, Compose, CI, build-once delivery, Terraform and Ansible, managed secrets, Kubernetes with Helm, GitOps with Argo CD, metrics, logs and traces, and SLOs with burn-rate alerts. Changes flow one way, from pull request to image to configuration commit to cluster, and rollback is a revert. A smoke test proves each deployment where users reach it. A game day tests the alerts, runbook and roles under controlled conditions, and its blameless postmortem turns surprises into action items. Knowing the limits of the setup, and the next steps beyond it, is part of doing DevOps well.
Try it yourself:
- Work through the path table and record, for each row, the command or link that proves it is done.
- Add
pebble-smoke.shto your CI pipeline so it runs against the Compose stack after the image builds, and make a failing smoke test block the merge. - Run the database-outage game day, write the postmortem with your real timeline, complete one action item and run it again.
- Design a second game day: stop the Valkey cache, or delete one app Pod in kind. Write the hypothesis first, then check it.
- Write your portfolio
README.mdand a three-minute capstone story, and practice it out loud with someone who will ask "why?" at least twice.
Sources checked on 16 November 2026: Google SRE workbook chapters on alerting on SLOs and postmortem culture; the Google SRE book chapter on managing incidents; AWS Well-Architected guidance on game days; Argo CD resource hooks; curl's --write-out variables; the Chaos Mesh, LitmusChaos and AWS Fault Injection Service project pages; and the roadmap.sh DevOps roadmap. Pebble, its game day and its postmortem are fictional.