
DevOps course · lesson 21 of 24
- 1What Is DevOps?
- 2A Language and a Service to Operate
- 3Linux and the Terminal
- 4Bash Scripting for Ops
- 5Git and Collaboration
- 6Networking for DevOps
- 7Web Servers, Proxies and Load Balancers
- 8Docker for DevOps
- 9Docker Compose and Multi-Service Apps
- 10Cloud Providers: AWS, Azure and Google Cloud
- 11Serverless Functions and Platforms
- 12Terraform and Infrastructure as Code
- 13Ansible and Configuration Management
- 14Continuous Integration with GitHub Actions and GitLab CI
- 15Continuous Delivery and Deployment Strategies
- 16Secret Management
- 17Kubernetes Basics
- 18Kubernetes in Practice
- 19GitOps with Argo CD and Flux
- 20Service Mesh: Istio, Linkerd, Consul and Envoy
- 21Metrics and Alerting with Prometheus and Grafana
- 22Logs and Tracing with Loki, Elastic and OpenTelemetry
- 23Reliability, SLOs and Cloud Design Patterns
- 24Capstone: Pebble to Production
After this lesson, you will be able to explain how Prometheus collects time-series metrics, write useful PromQL queries, connect Grafana to Prometheus, and describe what makes an alert actionable. You will also be able to use the four golden signals to review a service and compare Prometheus and Grafana with Zabbix, Datadog, Dynatrace and New Relic.
In Kubernetes in Practice, Pebble gained health checks, resource requests and a way to scale a stateless workload. Those settings help a cluster manage the service, but they do not tell an operator whether users are having a good experience. A Pod can be Ready while a route is slow. A process can be healthy while the database connection pool is nearly full. Metrics help a team see such changes over time.
Metrics are measurements over time
A metric is a numeric measurement recorded with a name, a value and a timestamp. A time series is one metric identified by its label values. For example, http_requests_total{route="/links",method="POST",status="201"} is a counter series for one route, method and status. As requests arrive, its value increases. A different status code or route is a different series.
Labels let an operator group or filter measurements. They also need care. A label such as route="/links/{code}" has a small, predictable set of values. A label such as user_id="582190" may create a new series for every user. This is high cardinality: it uses more memory and storage and can make queries slower. Keep identifiers, request IDs, email addresses and raw URLs out of metric labels. Put those details in logs or traces.
Prometheus stores samples as time series and typically collects them by scraping an HTTP metrics endpoint on a schedule. An application or an exporter exposes the endpoint. An exporter translates measurements from a system that does not speak Prometheus directly, such as a database, network device or external website. Prometheus discovers targets from configuration, requests each target and stores the returned samples. It also exposes its own metrics, so the collection system can be monitored. The Prometheus project describes its server, client libraries, exporters, rules and optional Alertmanager as components that can be combined as needed (Prometheus overview).
Prometheus fits numeric service and infrastructure measurements, especially where teams want a flexible query language and direct control over collection. Its local time-series database is designed for operational monitoring, not as a permanent accounting ledger. Do not use sampled metrics as the authoritative record for billing or individual transactions. Use a durable transactional store for that.
Choose metrics that answer questions
Start with a question, then choose a measurement that can answer it. "Is the service failing?" might use successful probe results. "Are requests getting slower?" needs a request-duration measurement. "Is the process running out of memory?" needs a resource metric and a useful limit for comparison. A metric without a question often becomes a chart no one checks.
Metric names have conventions that help readers infer behavior. A counter only increases except when the process restarts; examples include total requests and total errors. A gauge can go up or down; examples include current connections, memory in use and queue size. A histogram groups observations into buckets and tracks their count and sum, which makes it possible to estimate latency distributions across instances. A summary also estimates quantiles, but those quantiles generally cannot be combined across replicas like histogram buckets can. Prometheus recommends applying rate() to counters before aggregating them, so counter resets can be handled correctly (query functions, histograms and summaries).
A useful Pebble instrumentation plan could include:
pebble_http_requests_total, a counter labelled with bounded route, method and status class.pebble_http_request_duration_seconds, a histogram with buckets around response times that matter to the service.pebble_db_connections_in_use, a gauge if the application or database exposes connection-pool measurements.pebble_cache_operations_total, a counter labelled with operation and result, never with each cache key.
These are proposed names, not metrics emitted by the current Pebble code. The app in Docker Compose and Multi-Service Apps emits JSON logs and has /healthz and /readyz, but it does not expose /metrics. The lab below probes its real readiness endpoint from outside the app. Adding request counters and histograms would require a Prometheus client library, instrumentation around the request handler and a careful choice of routes and outcomes to measure.
The four golden signals
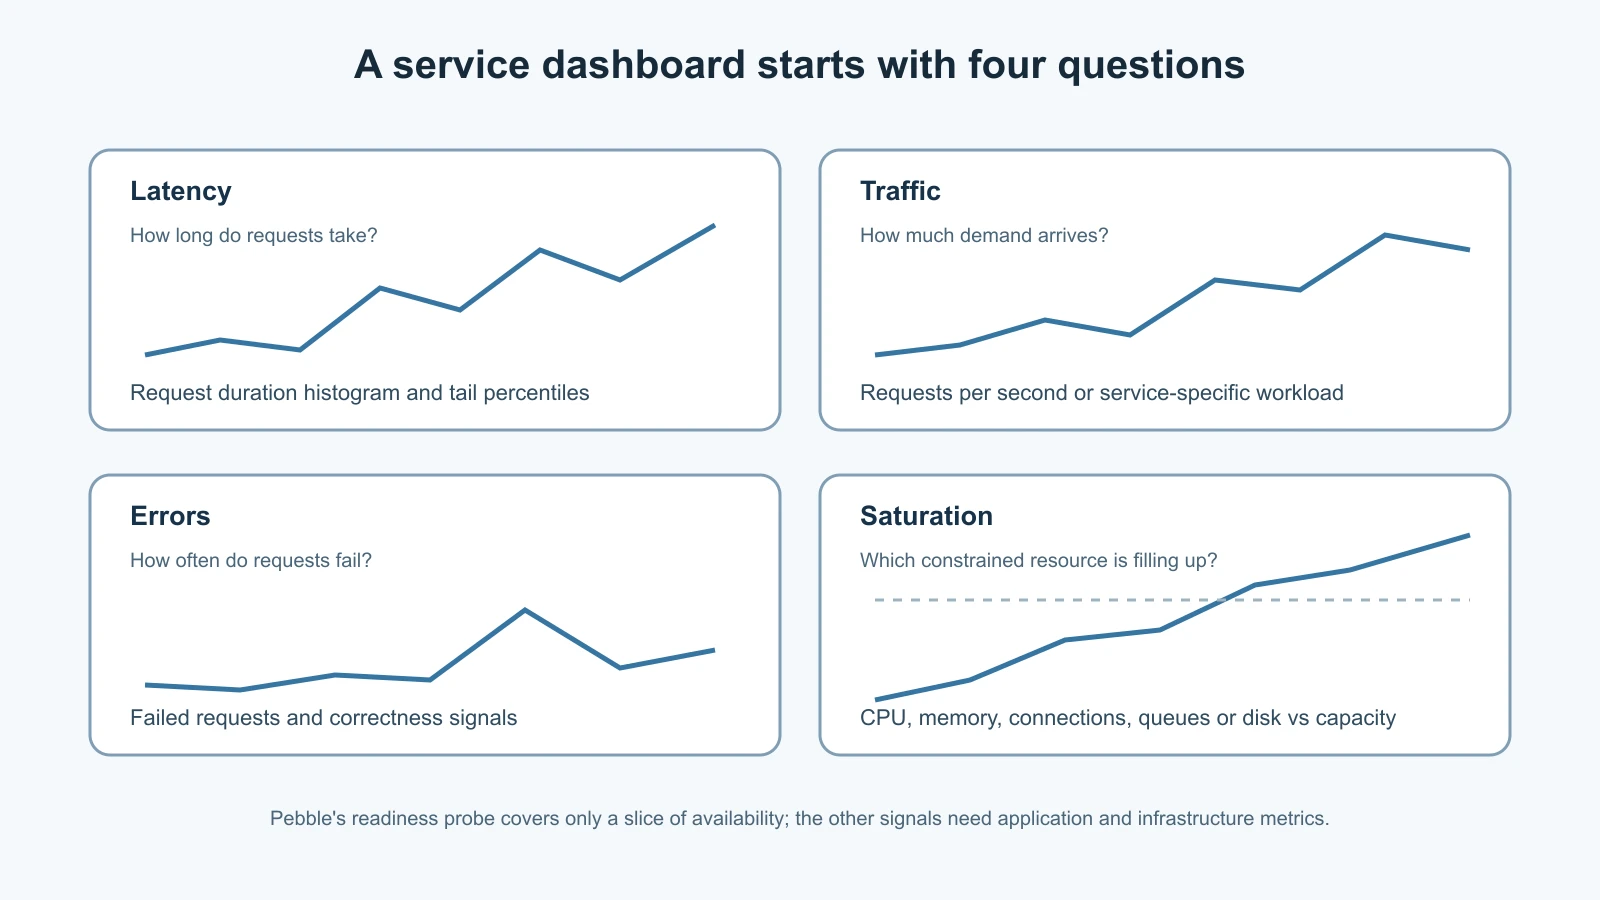
Google's SRE guidance groups the first questions about a user-facing service into latency, traffic, errors and saturation (Monitoring Distributed Systems). They form a practical service review:
| Signal | What to ask | Possible Pebble measurement |
|---|---|---|
| Latency | How long do requests take? | HTTP request duration histogram, split by bounded route and outcome. |
| Traffic | How much demand arrives? | Request counter converted to requests per second; active requests if available. |
| Errors | How often does a request fail? | Failed requests divided by all requests, including incorrect success responses. |
| Saturation | Which constrained resource is filling up? | CPU, memory, database connections, disk space or queue depth compared with capacity. |
Latency needs context. A quick 500 is still an error, even though it may lower average response time. Measure the duration distribution and error rate separately. For tail latency, a histogram lets Prometheus estimate a percentile across instances if its bucket boundaries are appropriate. Averages can hide a small set of painfully slow requests.
Traffic depends on the service. Requests per second fit a web API; a queue worker may care about jobs received and completed; a database may need transactions per second. Error measurement goes beyond status codes. A handler that returns 200 with the wrong result has still failed the user. Saturation is the resource most likely to become the bottleneck, not always CPU. A service with low CPU can still be unable to serve requests because it has no free database connections or disk space.
The Pebble readiness probe is one narrow availability signal. It tells us whether configured dependencies allow Pebble to serve requests at the time of the probe. It does not report user request rate, request latency distribution, business correctness, container CPU or memory. A production dashboard should combine app instrumentation, host or container metrics, dependency metrics and synthetic checks, with clear ownership for each source.
PromQL: turn samples into useful views
PromQL is Prometheus's query language. A simple selector such as up returns the latest scrape status for each target. Selectors can filter by labels: up{job="pebble-blackbox"} shows just the Pebble probe target. A range selector such as pebble_http_requests_total[5m] asks for samples from the last five minutes. Functions and aggregations turn raw samples into an answer.
If the app exposes an http_requests_total counter, this expression calculates requests per second over five minutes:
1sum by (route) (rate(http_requests_total[5m]))rate() handles counter resets and estimates the per-second increase. sum by (route) combines instances while retaining the route label. Apply rate() before summing; otherwise a restart can make the aggregate appear to drop in a confusing way. To calculate an error fraction, if the metric has a bounded status label, one possible query is:
1sum(rate(http_requests_total{status=~"5.."}[5m])) / sum(rate(http_requests_total[5m]))This depends on the app instrumenting all requests consistently. It is not usable against the current Pebble container because that metric does not exist. When the denominator is zero, handle the empty or no-traffic case thoughtfully rather than displaying a misleading result.
Classic histogram buckets can estimate the 95th percentile with histogram_quantile(0.95, sum by (le, route) (rate(http_request_duration_seconds_bucket[5m]))). The le label represents the bucket boundary. This is an estimate, not a guarantee that precisely 95 percent of requests completed below that value. Bucket design matters: if thresholds do not match the times users care about, the estimate is less informative.
For a saturation metric that is a gauge, max by (instance) (process_resident_memory_bytes) might show memory usage. That is not a percentage of a container limit. To show memory fraction, the numerator needs a matching, accurately labelled memory-limit metric. Avoid combining unrelated series and assuming the result represents a meaningful capacity ratio.
Try each expression in the Prometheus expression browser first. Check which series match, inspect label values and verify the unit. Then graph it across an interval. PromQL returns numbers, not explanations: a chart still needs a title, unit, time range and threshold that helps someone decide what to do.
Build a local probe lab
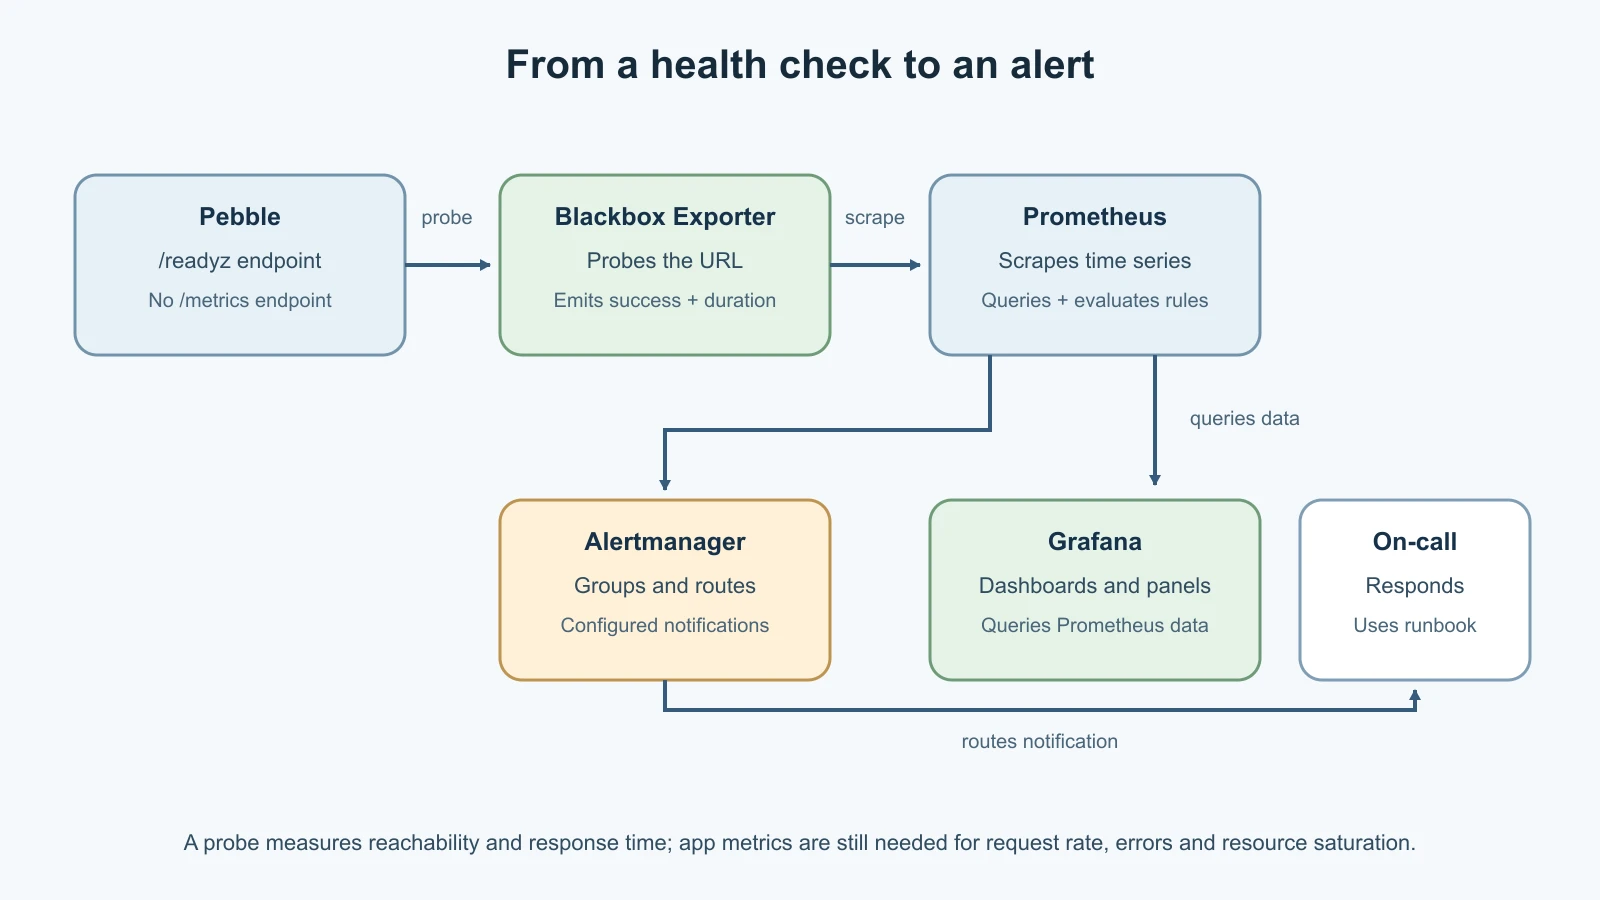
This lab uses Docker Compose, Prometheus 3.16.0, Grafana 13.3.1 and Blackbox Exporter 0.28.0. Grafana publishes its open source build as the grafana/grafana image; the older grafana/grafana-oss image name stopped receiving new versions after Grafana 13.0.2 in June 2026, so use grafana/grafana for current releases. These versions were current on 14 November 2026 (Prometheus downloads, Grafana downloads, Blackbox Exporter releases). It assumes the Pebble Compose project from the earlier lab. The observability stack and Pebble share a dedicated Docker network so the probe can reach the proxy without publishing an extra host port. The stack probes /readyz and records probe success and duration. Blackbox Exporter makes the request and returns metrics about that probe; it does not add application request counters to Pebble.
Create a separate observability directory beside the Pebble project. Add compose.yaml:
1services:
2  prometheus:
3    image: prom/prometheus:v3.16.0
4    command:
5      - --config.file=/etc/prometheus/prometheus.yml
6      - --storage.tsdb.path=/prometheus
7      - --storage.tsdb.retention.time=7d
8    ports:
9      - "127.0.0.1:9090:9090"
10    volumes:
11      - ./prometheus.yml:/etc/prometheus/prometheus.yml:ro
12      - ./alerts.yml:/etc/prometheus/alerts.yml:ro
13      - prometheus-data:/prometheus
14    networks: [monitor]
15    depends_on:
16      - blackbox
17    restart: unless-stopped
18
19  blackbox:
20    image: prom/blackbox-exporter:v0.28.0
21    command:
22      - --config.file=/etc/blackbox/blackbox.yml
23    volumes:
24      - ./blackbox.yml:/etc/blackbox/blackbox.yml:ro
25    networks: [monitor]
26    restart: unless-stopped
27
28  grafana:
29    image: grafana/grafana:13.3.1
30    ports:
31      - "127.0.0.1:3000:3000"
32    environment:
33      GF_SECURITY_ADMIN_USER: admin
34      GF_SECURITY_ADMIN_PASSWORD: local-only-change-me
35    volumes:
36      - grafana-data:/var/lib/grafana
37      - ./provisioning:/etc/grafana/provisioning:ro
38    networks: [monitor]
39    depends_on:
40      - prometheus
41    restart: unless-stopped
42
43volumes:
44  prometheus-data:
45  grafana-data:
46
47networks:
48  monitor:
49    name: pebble-observe
50    external: true
The ports bind to loopback so the local training interfaces are not exposed to the network. The Grafana password is only for this disposable lab; replace it for a shared or persistent instance. Compose service DNS lets Grafana reach Prometheus at http://prometheus:9090. Inside a container, localhost means that same container, not another service.
Create the shared network before either Compose project starts:
1docker network create pebble-observeIn the Pebble project's compose.yaml, add the monitor network to the proxy service's existing networks, then declare it as external at the end of that file. Keep its existing front network:
1services:
2  proxy:
3    networks: [front, monitor]
4
5networks:
6  monitor:
7    name: pebble-observe
8    external: true
This is a fragment showing changed lines, not a replacement for the complete Pebble Compose file. From the Pebble directory, run docker compose up -d to attach the proxy to the new network. The probe uses the proxy's service name on that private network. PostgreSQL and Valkey remain isolated on Pebble's internal back network.
Create blackbox.yml:
1modules:
2  http_2xx:
3    prober: http
4    timeout: 5s
5    http:
6      method: GET
7      preferred_ip_protocol: ip4
8      valid_status_codes: []
An empty valid_status_codes list uses the normal successful HTTP range. Create prometheus.yml:
1global:
2  scrape_interval: 15s
3  evaluation_interval: 15s
4
5rule_files:
6  - /etc/prometheus/alerts.yml
7
8scrape_configs:
9  - job_name: prometheus
10    static_configs:
11      - targets: ["prometheus:9090"]
12
13  - job_name: pebble-blackbox
14    metrics_path: /probe
15    params:
16      module: [http_2xx]
17    static_configs:
18      - targets: ["http://proxy/readyz"]
19    relabel_configs:
20      - source_labels: [__address__]
21        target_label: __param_target
22      - source_labels: [__param_target]
23        target_label: instance
24      - target_label: __address__
25        replacement: blackbox:9115
The second scrape job uses a relabeling pattern: Prometheus sends the URL as a target parameter to the exporter, then scrapes the exporter's /probe endpoint. The target becomes the instance label so the series identifies Pebble, while __address__ points at the exporter. This is why the probe result differs from a direct scrape of Pebble's nonexistent /metrics path.
Add alerts.yml:
1groups:
2  - name: pebble-probes
3    rules:
4      - alert: PebbleReadinessProbeFailing
5        expr: probe_success{job="pebble-blackbox"} == 0
6        for: 1m
7        labels:
8          severity: warning
9          service: pebble
10        annotations:
11          summary: Pebble readiness probe is failing
12          description: The /readyz probe has failed for at least one minute.
13
14      - alert: PebbleProbeLatencyHigh
15        expr: probe_duration_seconds{job="pebble-blackbox"} > 1
16        for: 5m
17        labels:
18          severity: warning
19          service: pebble
20        annotations:
21          summary: Pebble readiness probe is slow
22          description: The synthetic readiness check has exceeded one second for five minutes.
The one-second latency is an illustrative lab value, not a universal objective. A real alert should be tied to an SLO or user-facing impact, have a clear owner and give the recipient a next step. for requires the expression to remain true for a period before firing, which helps avoid paging on one transient sample. Prometheus marks alerts pending and firing, but these rules do not deliver messages themselves. For routed notifications, configure Alertmanager with receiver credentials and grouping, or use an alerting system that owns notification delivery. Keep secrets out of these files.
Start the stack from the observability directory:
1docker compose up -d
2docker compose ps
Open http://localhost:9090/targets. The Prometheus and pebble-blackbox targets should show UP. In the expression browser, query probe_success{job="pebble-blackbox"}; its value should be 1 while Pebble is ready. Query probe_duration_seconds{job="pebble-blackbox"} to see seconds for the synthetic request. Stop Pebble briefly with docker compose stop app in its own project, refresh after a scrape, then start it with docker compose start app. The probe should change to 0, and the alert becomes pending; it fires if the failure persists for a minute. This is a controlled check of a disposable local service. Do not run failure experiments against shared or production systems.
Prometheus stores metrics locally in a named volume. The seven-day retention setting keeps the lab bounded, but it is not a backup policy. A production monitoring system also needs its own access control, durable storage planning, capacity monitoring, upgrade process and backup or recovery design.
Create a Grafana view
Grafana reads Prometheus data and presents it as dashboards and panels. It does not collect or store this lab's Prometheus samples. Provision the data source by creating provisioning/datasources/prometheus.yml:
1apiVersion: 1
2
3datasources:
4  - name: Prometheus
5    type: prometheus
6    access: proxy
7    url: http://prometheus:9090
8    isDefault: true
9    editable: true
Open http://localhost:3000. Sign in as admin with the disposable lab password, then change it when prompted. The provisioned data source should appear under Connections. The URL uses the Compose service name because the containers share a network. Grafana's docs warn that localhost inside its container points back to Grafana, not Prometheus (Grafana Prometheus data source).
Create a dashboard called Pebble probe with two time-series panels. For Readiness, query probe_success{job="pebble-blackbox"} and set the unit to short; one means the probe succeeded. For Probe duration, query probe_duration_seconds{job="pebble-blackbox"} and set the unit to seconds. Add a description to each panel that says what it measures and where to investigate a failure. Save the dashboard, then stop and start the app once to see the panel change.
For a team dashboard, provision its JSON or dashboard file from version control instead of creating the only copy by hand. Treat dashboards as operational interfaces: put user outcomes near the top, show units, keep legends readable, and link to logs, traces or runbooks when available. Avoid dozens of panels that make the signal hard to find during an incident. A useful dashboard answers "Are users succeeding?" and points toward the next diagnostic step.
Alerts should prompt a useful action
A dashboard is something an operator opens to investigate. An alert is a notification asking for attention. Before creating one, answer: what is broken or at risk, who owns the response, how quickly must someone act, and what should they do first? A rule that fires repeatedly without a clear action becomes noise. A good alert identifies the affected service, condition, time window and a runbook or dashboard link.
Separate symptom alerts from cause signals. Sustained failed readiness or a high user-visible error rate may deserve an urgent response. Elevated CPU can help diagnose an incident, but CPU alone may have no user impact. If every short-lived spike notifies a person, they learn to ignore the system. Use a suitable evaluation window, intentional threshold, ownership and grouping. During an incident, review whether the alert arrived in time and suggested a useful action.
The sample probe_success rule detects that the readiness URL is unavailable. The duration rule is a teaching example; replace it with a threshold based on a latency SLI and its SLO before paging anyone. Teams may alert on a multi-window burn rate: how quickly a service is consuming its error budget over more than one time window. The design depends on the SLO and traffic shape. An alert on every request is too sensitive, while a long-window average alone can hide a sharp incident.
Prometheus evaluates rules and maintains their state. Alertmanager handles grouping, deduplication, silencing and routing to configured receivers. Grafana also has alerting workflows and can evaluate rules from supported sources. Decide which system owns each production rule and notification path to avoid duplicate pages. Start with one clear source of truth for a service's alerts.
Alarm on the serverless uptime check
Prometheus is not the only place alert rules live. In Serverless Functions and Platforms, Pebble's uptime checker published an Up metric to CloudWatch every five minutes through Embedded Metric Format log lines. An alarm turns that metric into a notification. On AWS, notifications usually go through an SNS topic, so create one and subscribe an email address you control:
1TOPIC_ARN=$(aws sns create-topic --name pebble-alerts --query TopicArn --output text)
2aws sns subscribe --topic-arn "$TOPIC_ARN" --protocol email \
3  --notification-endpoint you@example.com
Confirm the subscription from the email AWS sends. Then create the alarm, using the same Target value the checker reports, which is the PEBBLE_URL you deployed it with:
1aws cloudwatch put-metric-alarm \
2  --alarm-name pebble-uptime-down \
3  --namespace Pebble --metric-name Up \
4  --dimensions Name=Target,Value=https://pebble.example \
5  --statistic Minimum --period 300 \
6  --evaluation-periods 2 --datapoints-to-alarm 2 \
7  --threshold 1 --comparison-operator LessThanThreshold \
8  --treat-missing-data breaching \
9  --alarm-actions "$TOPIC_ARN" --ok-actions "$TOPIC_ARN"
Each five-minute period takes the lowest Up value, so any failed check in the period counts. Two failing periods in a row trigger the alarm, which avoids paging on a single blip while still reacting within about ten minutes. --treat-missing-data breaching is the important line: if the checker itself stops running, no data arrives, and the alarm fires instead of staying quietly green. That is the "monitor the monitoring" rule from the mistakes list below. The dimension must match the metric exactly, including any trailing slash, or the alarm watches a series that never receives data. Check the alarm with aws cloudwatch describe-alarms --alarm-names pebble-uptime-down, and remove it with aws cloudwatch delete-alarms --alarm-names pebble-uptime-down when you delete the checker.
This alarm and the Prometheus rule above watch the same service from two places. That is reasonable for a lab, but in production decide which system owns each alert and who receives it, so one outage does not produce duplicate pages.
Monitoring platforms in context
Prometheus and Grafana are a common open-source pairing, not the only reasonable design. Choose based on what the team needs to observe, where it runs, who operates it, how much data it retains and how notifications and support are handled.
| Platform | Typical strengths | Questions to evaluate |
|---|---|---|
| Prometheus + Grafana | Flexible metrics collection and PromQL with dashboards; self-managed or compatible hosted backends. | Who maintains storage, upgrades, access controls, alert routing and retention? |
| Zabbix | Integrated infrastructure monitoring with agents, templates, triggers, dashboards, discovery and distributed proxies. | Does its host-and-item configuration model fit the estate and team workflow? |
| Datadog | Hosted observability with agents, integrations, metric monitors and a broad set of product areas. | Review ingestion, retention, feature and host pricing, and data governance for your usage. |
| Dynatrace | Managed observability with application and infrastructure monitoring, anomaly detection, and contextual problem analysis. | Check instrumentation, supported environments, data controls and licensing fit. |
| New Relic | Hosted telemetry with infrastructure agents, integrations, dashboards, queries and alert conditions. | Estimate ingestion and retention needs, account model and team skills. |
Zabbix is an integrated monitoring system with server, database, web interface, agents and optional proxies; checks are organized as hosts, items, triggers and actions (Zabbix overview). Datadog monitors evaluate metrics or integration and endpoint health, then send notifications (Datadog monitors). Dynatrace describes anomaly-based and custom metric alerts, with related events grouped into problems and enriched with dependency context (Dynatrace alerting). New Relic's infrastructure agent and integrations collect system and application environment data; its alert conditions can be created in context of infrastructure charts (New Relic infrastructure monitoring, infrastructure alerts). Features and pricing change, so compare current official plans before making a purchasing decision. This is a selection framework, not a benchmark or a claim that one product is always cheaper or better.
A small team may prefer a managed service to avoid operating a metrics database. Another may need self-hosted components for data control or already have the necessary skills. A mixed environment may use different systems for network devices, application traces and cloud metrics, but extra tools add integration and ownership work. Choose a small set, assign each alert to a responding team and document retention and access.
Mistakes beginners make
- Collecting every possible label. Unbounded values multiply time series. Keep labels useful, stable and small.
- Treating a probe as full observability. One successful readiness request says little about throughput, request latency distributions or saturation.
- Using a counter value as a rate. A lifetime total cannot show current demand. Use
rate()over a suitable range. - Aggregating before applying
rate(). Per-series resets become harder to interpret. Applyrate()first, then aggregate. - Alerting without an owner or action. Add responsibility, context and a runbook step, or the notification becomes noise.
- Building a dashboard with no units. Label seconds, bytes, requests per second and percentages so people do not guess.
- Assuming green means correct. Telemetry can be missing, stale or wrongly instrumented. Monitor the monitoring path and test the signal.
Recap and try it yourself
Prometheus scrapes numeric metrics into time series. PromQL selects, calculates and aggregates samples. Grafana queries Prometheus and presents results in dashboards, while alert rules detect conditions that need attention. The four golden signals offer a useful start: latency, traffic, errors and saturation. They are a checklist, not a substitute for understanding Pebble's user journeys and bottlenecks.
Start the Compose observability lab and confirm both scrape targets are healthy. Find readiness and probe duration in Prometheus, then open the Grafana dashboard. Stop the Pebble app briefly and observe what changes. Restore it, verify the alert clears, and shut down the lab with docker compose down from the observability directory. Keep named data volumes if you want the dashboards and sample history for another session. To remove lab data as well, use docker compose down -v only in this dedicated directory.
Then sketch the application instrumentation needed to answer these questions: request rate by bounded route, fraction of failed requests, request latency distribution and one constrained resource. For each metric, state its type, unit, labels and owner. This design exercise does not change the current Pebble app.
Go deeper
- Prometheus overview, PromQL basics and alerting rules
- Grafana provisioning and Prometheus data source setup
- Google SRE: Monitoring Distributed Systems
- Zabbix overview and Datadog monitors
- Dynatrace alerting and New Relic infrastructure monitoring
- Pair these measurements with logs and traces so an operator can connect a visible symptom to the events and request paths that explain it.
Sources checked on 14 November 2026, and the Grafana image and CloudWatch alarm details on 16 November 2026: Prometheus overview, downloads, querying functions and alerting rules; Blackbox Exporter releases; Grafana downloads, the grafana/grafana image and Prometheus data source documentation; Google SRE Monitoring Distributed Systems; the AWS CLI put-metric-alarm reference and CloudWatch guidance on missing data; and the official Zabbix, Datadog, Dynatrace and New Relic pages linked above. Pebble is fictional.