
DevOps course · lesson 22 of 24
- 1What Is DevOps?
- 2A Language and a Service to Operate
- 3Linux and the Terminal
- 4Bash Scripting for Ops
- 5Git and Collaboration
- 6Networking for DevOps
- 7Web Servers, Proxies and Load Balancers
- 8Docker for DevOps
- 9Docker Compose and Multi-Service Apps
- 10Cloud Providers: AWS, Azure and Google Cloud
- 11Serverless Functions and Platforms
- 12Terraform and Infrastructure as Code
- 13Ansible and Configuration Management
- 14Continuous Integration with GitHub Actions and GitLab CI
- 15Continuous Delivery and Deployment Strategies
- 16Secret Management
- 17Kubernetes Basics
- 18Kubernetes in Practice
- 19GitOps with Argo CD and Flux
- 20Service Mesh: Istio, Linkerd, Consul and Envoy
- 21Metrics and Alerting with Prometheus and Grafana
- 22Logs and Tracing with Loki, Elastic and OpenTelemetry
- 23Reliability, SLOs and Cloud Design Patterns
- 24Capstone: Pebble to Production
After this lesson, you will be able to explain how structured logs differ from plain text, collect Pebble's Docker logs with Grafana Alloy and Loki, find events with LogQL, and describe how OpenTelemetry spans are sent to Jaeger. You will also be able to connect a log event, a metric change and a trace during an investigation, and decide when the Elastic Stack or another log platform might fit better.
In Metrics and Alerting with Prometheus and Grafana, Pebble gained a synthetic readiness probe and a dashboard showing whether it can answer. A metric can tell us that error responses increased. It usually cannot show the exact request, application message or database operation behind that change. Logs record individual events. Traces connect the timed operations that made up one request. Each signal answers a different part of the incident question.
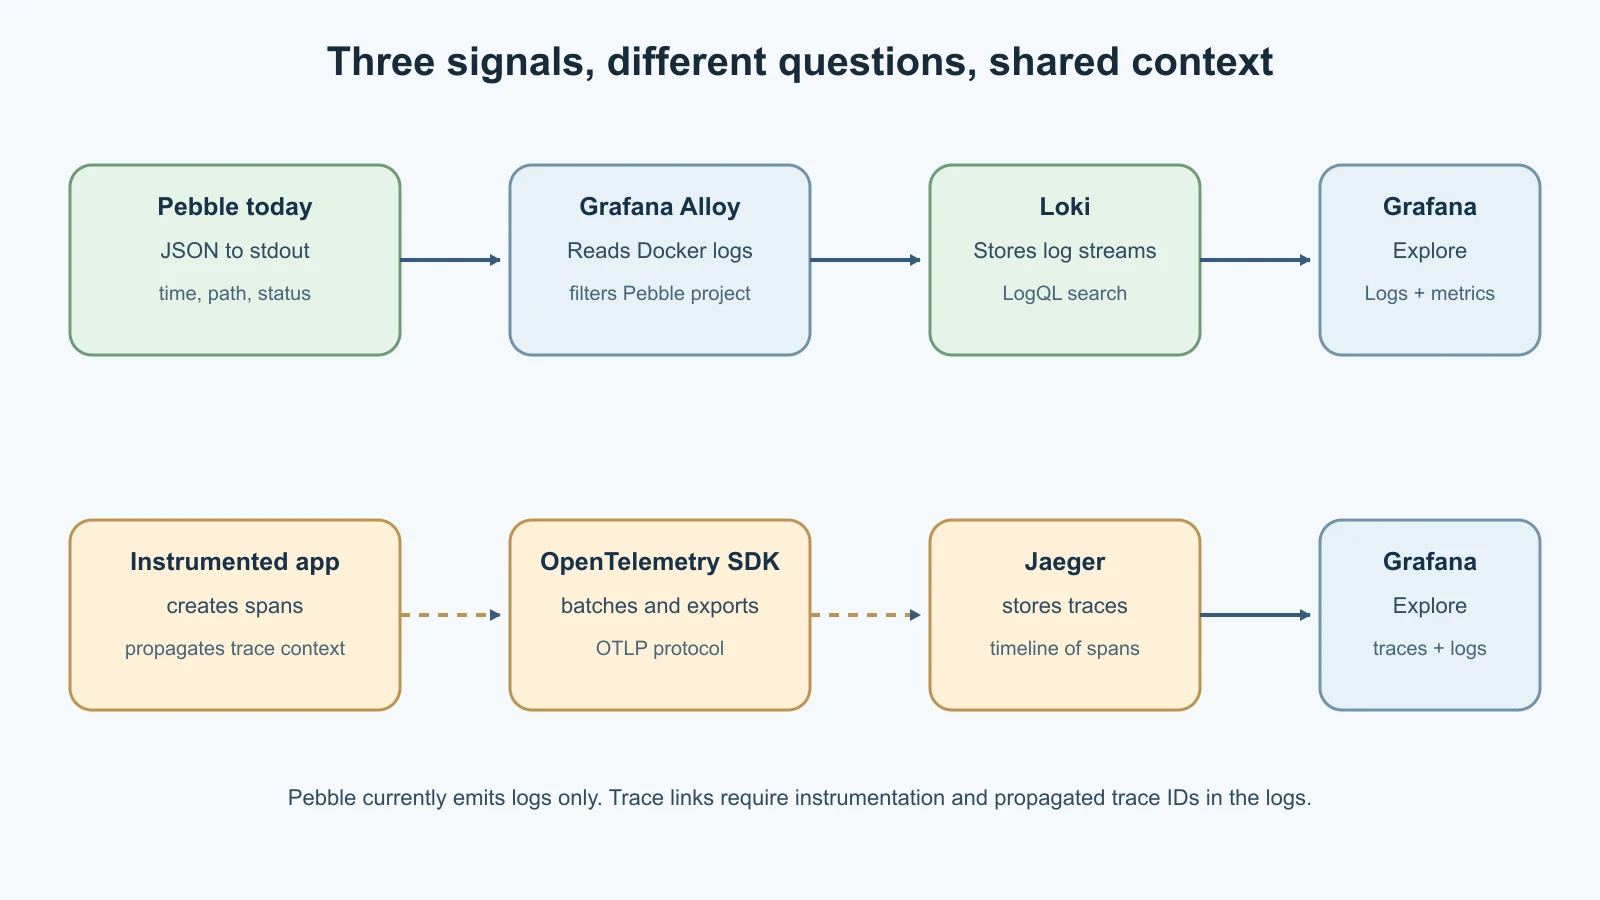
Logs are event records
A log event is a record that something happened at a point in time. An application might log that it started, received a request, failed to connect to a database or rejected invalid input. A log line can be plain text, such as database connection failed, or a structured record with named fields such as timestamp, severity, service, operation and error.
Pebble already writes one JSON object per event to standard output. A request log contains fields such as time, level, message, method, path and status. The app deliberately avoids logging the long URL submitted to the shortener. That is a useful default: logs are copied, retained and searchable, so any personal or secret information added to them may spread well beyond the application database. In the Compose lab, Docker captures the output from every container, and an agent can collect it without changing where Pebble writes.
Structured logs are easier to filter than a sentence whose format changes from one code path to another. A query can select all events with status 500, group by service, or find messages with a particular error class. Keep field names and types consistent. Timestamps should include a timezone, severity should use a small set of values, and each event should describe what happened in terms an operator can understand. Include enough context to investigate, but do not record passwords, access tokens, session cookies, full authorization headers or unnecessary user data.
Logs are not a substitute for metrics. A metric can summarize thousands of requests as a rate or percentile without storing every event. A log is useful for inspecting individual events, but computing a stable service-level error rate by repeatedly scanning every line can be inefficient and expensive. Logs can also be incomplete: a process may crash before flushing a message, an agent may fall behind, or retention may remove the period under investigation.
Collect and search logs
A log collector reads events from an application, host or container, adds source context and forwards them to a storage and query system. Some collectors parse the event as they ingest it. Others leave the line intact and let the query tool parse fields later. Think through where collection happens, what happens when the destination is unreachable, how data is buffered, and how to confirm that all expected sources are still reporting.
For this lab, Grafana Alloy discovers Docker containers and reads their logs from the Docker API. It forwards the selected Pebble events to Loki, a log aggregation system. Loki organizes events into streams using labels and indexes that label metadata, while keeping the original log contents in compressed chunks. A query first selects a stream and then examines matching lines. This design makes label choice important. Use stable, low-cardinality labels such as service, environment and region. Do not make trace_id, user_id, request ID, raw URL or container ID an indexed Loki label. Use parsed fields or structured metadata for high-cardinality details. The Loki documentation recommends Alloy as a log sender, and explains its labels and storage model (Loki overview, label guidance).
The core Elastic Stack has Elasticsearch for indexing, searching and analytics, and Kibana for exploration, dashboards and management. Elastic Agent collects and forwards data, while Logstash can handle more complex ingest and transformation pipelines. The name ELK refers to Elasticsearch, Logstash and Kibana, although current Elastic deployments may use Elastic Agent or other ingest paths rather than Logstash in every setup (Elastic Stack overview). Elastic commonly indexes searchable fields from events, while Loki indexes stream labels and searches line content after selecting streams. Neither design eliminates the need to select logs, retain them appropriately and control access. Compare the ingest, query, storage and operating requirements for your data volume and skills.
A request has a path, not just a line
A trace records the path of one operation through software. A trace is made of spans. Each span represents timed work, such as handling an HTTP request, querying a database or calling another service. A parent span can contain child spans; each span carries a trace ID, its own span ID, timing and attributes. A trace viewer lays these spans out so an operator can see where time was spent and which operation failed.
For one Pebble request, an instrumented trace might contain an incoming POST /api/links server span, a child span for writing a row to PostgreSQL and a child span for a cache operation. The existing Pebble app does not emit these spans. Its JSON request event records the HTTP method, path and response code, but not a trace ID or timed database span. The trace diagram shows a proposed instrumented request path, not telemetry the current app already produces.
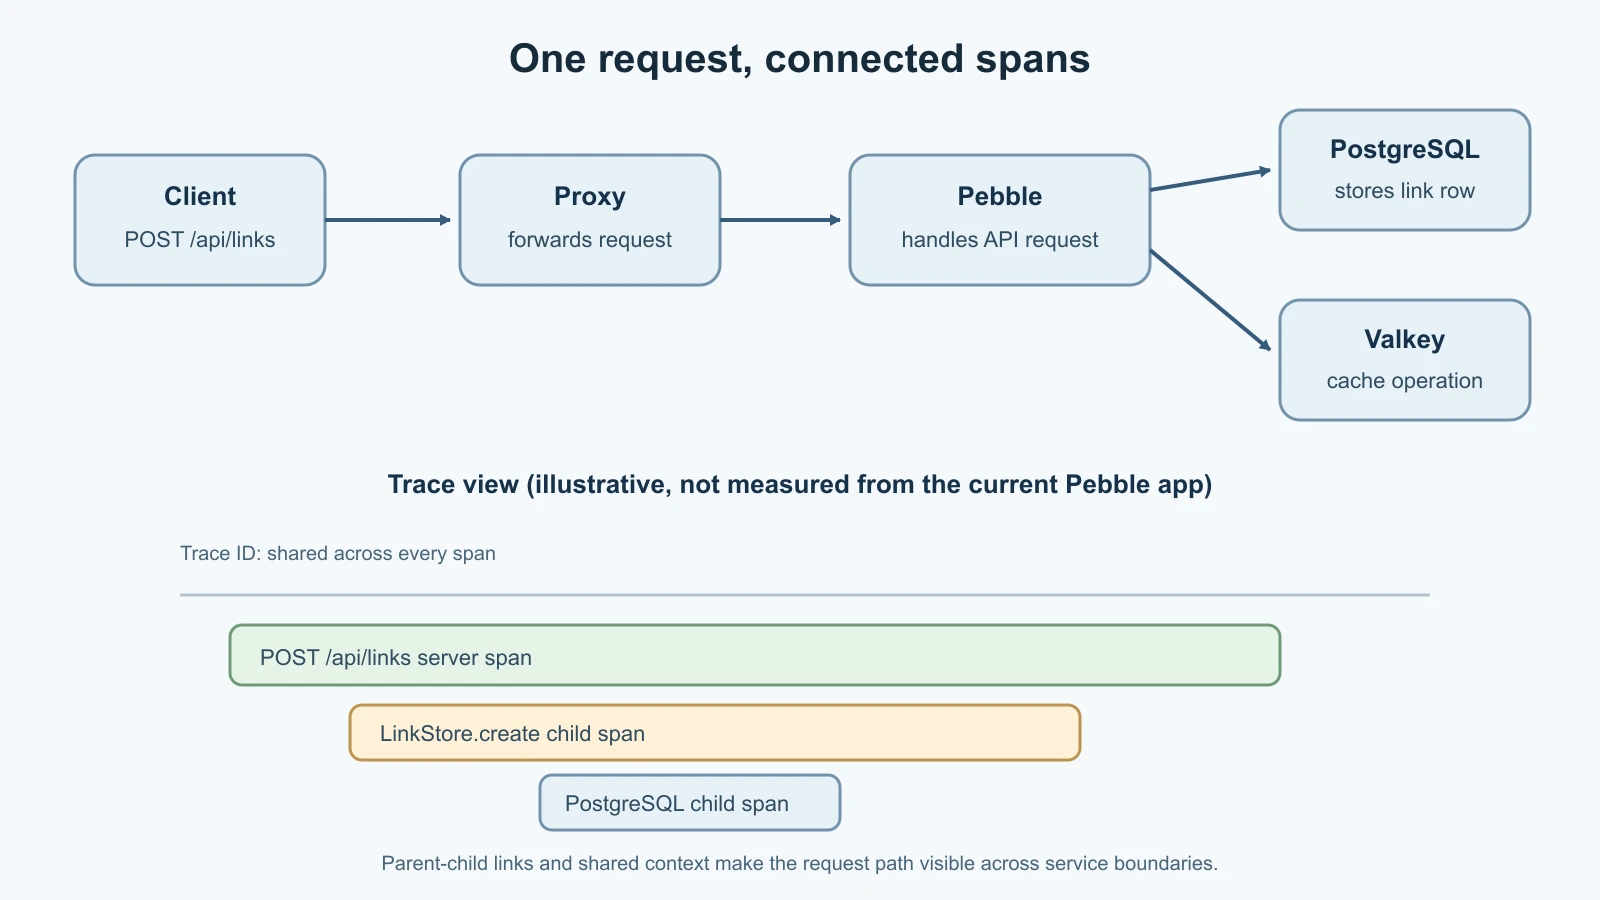
OpenTelemetry (OTel) is a vendor-neutral set of APIs, SDKs, semantic conventions and protocols for producing and exporting telemetry. The application or an instrumentation library creates spans and attaches attributes. An SDK handles sampling, batching and export. The OpenTelemetry Protocol (OTLP) carries telemetry to a receiver such as a collector or a compatible backend. A team can then change its backend without rewriting every application integration. The OpenTelemetry Collector can receive, process and export telemetry, and is often useful when several applications need the same routing, filtering or authentication policy.
Jaeger stores and presents traces. Jaeger v2 uses the OpenTelemetry Collector framework and accepts traces over OTLP. Its all-in-one image is useful for a local single-instance demonstration; its in-memory storage is temporary and loses traces when the process restarts (Jaeger getting started, architecture). Jaeger is not a logging backend, and it does not make an application produce traces by itself. The service must be instrumented and configured to send spans.
Propagate context and connect the signals
When one service calls another, context propagation carries trace and span identifiers across the process boundary. OpenTelemetry uses the W3C Trace Context format by default; HTTP requests commonly carry it in a traceparent header. The receiving service extracts that context, creates a child span and forwards context to its own downstream calls. Without propagation, the trace may split into unrelated pieces even if each service is instrumented (OpenTelemetry context propagation).
For logs and traces to connect precisely, an application should write the active trace ID and span ID into log records when it has an active span. OpenTelemetry's log data model includes trace context fields so a backend can link related records (OpenTelemetry log correlation). Pebble's current log() helper does not have that context. Adding trace_id to its output requires adding tracing instrumentation and context-aware logging, then ensuring the trace headers are propagated to dependencies. Do not invent an ID at the logging layer and call it a distributed trace: an identifier only correlates the work if the services share and propagate the same context.
Metrics help notice and measure a pattern. For example, a dashboard can show that Pebble's request errors rose at 10:05. Logs can show which paths returned 500 around 10:05, and include an error message. A trace can reveal that the slow portion of one failed request was a database call. In an integrated Grafana setup, a panel can link to relevant logs or traces; this depends on each signal containing compatible service names, timestamps and correlation fields. If the request never had a trace ID, the operator can still use service and time to narrow down events, but the match is approximate.
Use the signals together as a debugging sequence. Start with a symptom and time window from a metric or alert. Find logs for the affected service and operation. If the record includes a trace ID, open that trace and inspect its spans. If not, use the timestamp, route and response status to narrow the log search, then compare the likely downstream operations. Confirm the suspected cause with a second source, such as a database metric or a repeatable test. This process is more reliable than treating one red panel or one error line as a complete explanation.
Run the local Loki log lab
This lab adds Loki 3.7.10, Grafana Alloy 1.21.0 and Jaeger 2.23.0 to the pebble-observe network from the previous monitoring lab. Loki 3.7.10 and Alloy 1.21.0 were current releases on 14 November 2026 (Loki release notes, Alloy v1.21 release); Jaeger v2.23.0 is the current version in its official download guide (Jaeger downloads). Use the same observability directory that contains the Prometheus and Grafana Compose setup, the pebble-observe external network, and the Pebble project whose proxy is attached to that network.
The Docker socket gives a container access to a broad set of Docker operations and is effectively privileged host access. This Alloy setup is for an isolated local learning environment only. Do not mount the socket into a shared, internet-facing or production service. The configuration below filters discovered containers to the Compose project named pebble. Confirm the project label and Docker socket path on your machine. Docker Desktop can use a socket path that differs from /var/run/docker.sock; inspect the active Docker context and change the left side of the socket mount to match it.
Create loki-config.yaml:
1auth_enabled: false
2server:
3  http_listen_port: 3100
4common:
5  path_prefix: /loki
6  storage:
7    filesystem:
8      chunks_directory: /loki/chunks
9      rules_directory: /loki/rules
10  replication_factor: 1
11  ring:
12    kvstore:
13      store: inmemory
14schema_config:
15  configs:
16    - from: "2024-04-01"
17      store: tsdb
18      object_store: filesystem
19      schema: v13
20      index:
21        prefix: index_
22        period: 24h
23limits_config:
24  allow_structured_metadata: true
This single-process filesystem configuration is for a local exercise, not a multi-node or durable production setup. Loki does not provide an authentication layer by itself. This stack keeps its API on the private Docker network and does not publish port 3100 on the host. If you expose Loki elsewhere, put an authenticated and appropriately secured gateway in front of it (Loki local setup).
Create alloy.alloy:
1discovery.docker "pebble" {
2  host = "unix:///var/run/docker.sock"
3  refresh_interval = "5s"
4}
5
6discovery.relabel "pebble" {
7  targets = discovery.docker.pebble.targets
8
9  rule {
10    source_labels = ["__meta_docker_container_label_com_docker_compose_project"]
11    regex = "pebble"
12    action = "keep"
13  }
14
15  rule {
16    source_labels = ["__meta_docker_container_label_com_docker_compose_service"]
17    target_label = "service"
18  }
19
20  rule {
21    source_labels = ["__meta_docker_container_name"]
22    regex = "/(.*)"
23    target_label = "container"
24  }
25}
26
27loki.source.docker "pebble" {
28  host = "unix:///var/run/docker.sock"
29  targets = discovery.relabel.pebble.output
30  labels = { job = "pebble" }
31  forward_to = [loki.process.pebble.receiver]
32}
33
34loki.process "pebble" {
35  stage.docker { }
36
37  stage.json {
38    expressions = {
39      level = "level",
40      message = "message",
41      status = "status",
42      trace_id = "trace_id",
43    }
44  }
45
46  stage.labels {
47    values = { level = "level" }
48  }
49
50  stage.structured_metadata {
51    values = { trace_id = "trace_id" }
52  }
53
54  forward_to = [loki.write.local.receiver]
55}
56
57loki.write "local" {
58  endpoint {
59    url = "http://loki:3100/loki/api/v1/push"
60  }
61}
The discovery filter reads the Compose project label and keeps only pebble containers. A service label distinguishes the app from the proxy, cache and database. The severity label is low-cardinality, so it is reasonable as a stream label; trace_id, when present in a future instrumented log, becomes structured metadata instead of an index label. Loki only receives what the collector reads from the Docker daemon; filtering at discovery avoids shipping unrelated containers into this lab.
Add the following services and volume to compose.logs.yaml in the observability directory:
1services:
2  loki:
3    image: grafana/loki:3.7.10
4    command: ["-config.file=/etc/loki/loki-config.yaml"]
5    volumes:
6      - ./loki-config.yaml:/etc/loki/loki-config.yaml:ro
7      - loki-data:/loki
8    networks: [monitor]
9    restart: unless-stopped
10
11  alloy:
12    image: grafana/alloy:v1.21.0
13    command:
14      - run
15      - --server.http.listen-addr=0.0.0.0:12345
16      - --storage.path=/var/lib/alloy/data
17      - /etc/alloy/config.alloy
18    volumes:
19      - ./alloy.alloy:/etc/alloy/config.alloy:ro
20      - /var/run/docker.sock:/var/run/docker.sock:ro
21      - alloy-data:/var/lib/alloy/data
22    ports:
23      - "127.0.0.1:12345:12345"
24    networks: [monitor]
25    depends_on: [loki]
26    restart: unless-stopped
27
28  jaeger:
29    image: cr.jaegertracing.io/jaegertracing/jaeger:2.23.0
30    ports:
31      - "127.0.0.1:16686:16686"
32      - "127.0.0.1:4317:4317"
33    networks: [monitor]
34    restart: unless-stopped
35
36volumes:
37  loki-data:
38  alloy-data:
39
40networks:
41  monitor:
42    name: pebble-observe
43    external: true
If your Docker context uses a different socket location, replace /var/run/docker.sock on the left side of the Alloy volume with the host path; keep /var/run/docker.sock on the right so the Alloy config still reaches the expected in-container path. A read-only bind mount does not make the Docker API itself read-only. Keep this local stack on loopback and stop it when the exercise is done.
Bring up the extended stack from observability:
1docker compose -f compose.yaml -f compose.logs.yaml up -d
2docker compose -f compose.yaml -f compose.logs.yaml ps
Generate a few disposable Pebble events from a second terminal. These commands use the existing application API and synthetic URLs:
1curl -i -X POST http://localhost:8080/api/links \
2  -H 'Content-Type: application/json' \
3  -d '{"url":"https://example.test/pebble-demo"}'
4
5curl -i -X POST http://localhost:8080/api/links \
6  -H 'Content-Type: application/json' \
7  -d '{'
The first request should create a link. The malformed JSON request should receive a client error. The current request logger records method, path and status but not the input URL, so the example does not put the synthetic URL into the log line.
Open Grafana at http://localhost:3000. Add a Loki data source with URL http://loki:3100, then open Explore and select Loki. Query {job="pebble", service="app"} to see app container events. To find the malformed request after parsing its JSON fields, use {job="pebble", service="app"} | json | status="400". The exact status is an example expectation from the Pebble handler; if your app returned another client error, use that status. Pebble currently logs every request at info, including client errors, so filter the parsed status field when you are looking for failed responses. A Loki query starts with stream labels, then can parse JSON or filter the resulting line. The search is over the events collected since Alloy started; it is not an audit record of every request ever sent to the service.
To inspect the collection pipeline, open Alloy at http://localhost:12345 and confirm the discovery, source, processing and write components are healthy. Loki's readiness endpoint, http://loki:3100/ready, is reachable from other containers on the pebble-observe network; port 3100 is intentionally not mapped to the host, so localhost:3100 on your machine will not answer. If no events arrive, verify that Pebble is producing container logs, that the Compose project label is pebble, that Alloy can reach the Docker socket, and that both Alloy and Loki share the pebble-observe network.
Send example spans to Jaeger
Jaeger receives traces only after a producer is instrumented. This small Python program creates a sample request span and a child storage span, then exports them to the Jaeger OTLP gRPC endpoint. It models a Pebble operation for learning purposes; it does not instrument or change the running Pebble service. Create a trace-demo directory and save this as trace_demo.py:
1import json
2import time
3
4from opentelemetry import trace
5from opentelemetry.exporter.otlp.proto.grpc.trace_exporter import OTLPSpanExporter
6from opentelemetry.sdk.resources import Resource
7from opentelemetry.sdk.trace import TracerProvider
8from opentelemetry.sdk.trace.export import BatchSpanProcessor
9
10
11provider = TracerProvider(
12    resource=Resource.create({"service.name": "pebble-trace-demo"})
13)
14provider.add_span_processor(
15    BatchSpanProcessor(
16        OTLPSpanExporter(endpoint="localhost:4317", insecure=True)
17    )
18)
19trace.set_tracer_provider(provider)
20tracer = trace.get_tracer("pebble.trace.demo")
21
22with tracer.start_as_current_span("POST /api/links") as request_span:
23    request_span.set_attribute("http.request.method", "POST")
24    request_span.set_attribute("http.route", "/api/links")
25    with tracer.start_as_current_span("LinkStore.create") as store_span:
26        store_span.set_attribute("db.system.name", "sqlite")
27        time.sleep(0.05)
28
29    context = request_span.get_span_context()
30    print(json.dumps({
31        "message": "sample request completed",
32        "trace_id": format(context.trace_id, "032x"),
33        "span_id": format(context.span_id, "016x"),
34    }))
35
36provider.force_flush()
37provider.shutdown()
Create requirements.txt with the matching OpenTelemetry packages pinned to 1.45.1:
1opentelemetry-api==1.45.1
2opentelemetry-sdk==1.45.1
3opentelemetry-exporter-otlp-proto-grpc==1.45.1
These packages were released 6 October 2026 (OpenTelemetry SDK on PyPI, OTLP gRPC exporter on PyPI). OpenTelemetry's Python guide documents the SDK and OTLP exporters used here (Python exporters).
Run Jaeger from the observability stack, then run the demo from trace-demo:
1python3 -m venv .venv
2source .venv/bin/activate
3python -m pip install -r requirements.txt
4python trace_demo.py
The program prints a JSON line with a 32-character trace ID and a 16-character span ID. Open http://localhost:16686, find service pebble-trace-demo, and open the trace. It should contain the request span with a nested LinkStore.create span. Jaeger's all-in-one uses in-memory storage, so these traces disappear when its container restarts. The example logs the root trace ID to stdout to make the ID visible for learning. The currently running Pebble app does not create corresponding spans or include the ID in its own event stream; an ID printed by this standalone program must not be mistaken for an end-to-end production trace.
Logs, metrics and traces in one investigation
Use a common service name and a consistent clock across telemetry sources. Keep the service name stable across deploys, and add a version or environment attribute where it helps compare behavior. When a trace ID is available, include it in the log event as a field and use the same ID in the trace backend. A Grafana Loki data source can link matching trace IDs to a Jaeger data source, so an operator can open the relevant trace from a log. Without that field, a shared time range and service label can still narrow the investigation, but will not uniquely identify one request.
The three signals have different cost and retention profiles. Metrics are compact aggregates that support trends and alerts. Logs hold detailed event records and can become expensive when volume and retention grow. Traces usually sample or otherwise control how many requests they retain; sampling policy affects which slow or failed requests are available to inspect. Do not use telemetry as the only permanent audit trail when records need a specific durability, access, retention or legal guarantee. Decide what to collect, how long to keep it and who can search it.
Other log platforms
The roadmap includes several systems because teams have different data, operating and procurement needs:
| Tool | Useful context |
|---|---|
| Elastic Stack | Search and analytics across structured events, with Elasticsearch, Kibana and flexible ingestion options such as Elastic Agent and Logstash. |
| Loki | Log streams organized by labels, with LogQL and close Grafana integration. |
| Graylog | Centralized ingestion through inputs, routing and search, with its own deployment and storage requirements. |
| Splunk | Search and reporting across indexed data, with saved searches, dashboards and alerting. |
| Papertrail | Hosted log aggregation with a live event viewer, search, saved searches and alerts. |
Graylog receives logs through configured inputs, routes them and provides search and analysis (Graylog inputs). Splunk's Search & Reporting app supports search, reports, saved searches, alerts and dashboards (Splunk Search app). Papertrail accepts HTTPS or syslog destinations and offers an event viewer with live tail, search and saved-search alerts (Papertrail destinations, event viewer). These short descriptions are orientation, not a product ranking. Review current supported inputs, access controls, retention and pricing against your actual workload before selecting a service.
Mistakes beginners make
- Logging everything. A high volume of low-value events makes incidents slower to investigate and increases storage use. Log meaningful transitions and failures.
- Putting secrets or full user input in events. Searchable telemetry has a wider audience and longer life than a request handler. Redact or omit sensitive values at the source.
- Using a request ID as a trace ID. A trace ID belongs to a propagated trace context. A local request identifier does not automatically connect spans across services.
- Making high-cardinality log labels. Values such as trace IDs and unique URLs belong in the line or structured metadata, not stream labels.
- Keeping no collection health signal. A quiet search can mean the app is idle, or it can mean the agent stopped. Monitor the pipeline and compare expected sources with collected sources.
- Assuming Jaeger creates traces. Instrument the application, choose an exporter and propagate context; the backend only receives telemetry that was produced and sent.
- Confusing a local demo with durable storage. Loki's local filesystem setup and Jaeger's in-memory all-in-one are disposable learning configurations.
Recap and try it yourself
Structured logs record individual events in searchable fields. Loki stores log streams and queries them with LogQL; Alloy collects Docker logs. A trace groups timed spans along a request path. OpenTelemetry provides vendor-neutral instrumentation and OTLP export, while Jaeger receives and displays traces. Metrics, logs and traces are most useful together when they share service identity, timestamps and trace context.
In the local lab, find Pebble's successful and malformed API requests in Loki. Confirm that the logged request contains method, path and status but does not reveal the submitted URL. Run the trace demo and open its spans in Jaeger. Compare the sample trace ID printed by the script with Pebble's logs: they do not match because the Pebble app has not been instrumented. Write down what instrumentation and propagation work would be required to make them match. Stop the Compose additions with docker compose -f compose.yaml -f compose.logs.yaml down; this removes the containers and keeps named data volumes. Remove the named volumes only if you intend to discard the local Loki and Alloy lab data.
Go deeper
- Grafana Loki overview, Loki label guidance and Grafana Alloy Docker log collection
- OpenTelemetry traces, context propagation and Python exporters
- Jaeger v2 getting started and OTLP APIs
- Elastic Stack overview, Graylog inputs, Splunk Search app and Papertrail event viewer
Sources checked on 14 November 2026: Grafana Loki overview, label guidance, local setup and v3.7 release notes; Grafana Alloy documentation; OpenTelemetry traces, context propagation, logs and Python exporters; Jaeger v2; and the Elastic, Graylog, Splunk and Papertrail pages linked above. The trace demo was run with OpenTelemetry 1.45.1 and printed a valid trace and span ID. Pebble is fictional.