
When a normal program misbehaves, you read the stack trace. When an agent misbehaves, there is no stack trace to read. The code ran fine. The model simply made a choice you did not expect, three steps ago, based on a tool result you never saw. To fix problems like that you need to see what the agent did and why, step by step. That is what observability is for. This lesson shows what to record, how to record it in tested Python, how to read the result when something goes wrong, and which tools can do the work for you.
Logs, traces, spans and metrics
Four words come up again and again:
- A log is a single line about an event: "tool failed".
- A trace is the full record of one run: everything that happened from the user's request to the final answer.
- A span is one step inside a trace, with a start, a duration and some details. A run is a span. Each model call is a span inside it. Each tool call is another.
- A metric is a number tracked over time across many runs: error rate, average cost, slowest 5 percent of runs.
Logs tell you something happened. Traces tell you how and why, because spans are linked: you can see that this tool call came from that model call, which came from that run. Langfuse's documentation calls traces structured logs of every request, and describes tracing as recording how a request flows through a system while keeping the cause-and-effect links between operations. That is a good short definition.
What to record
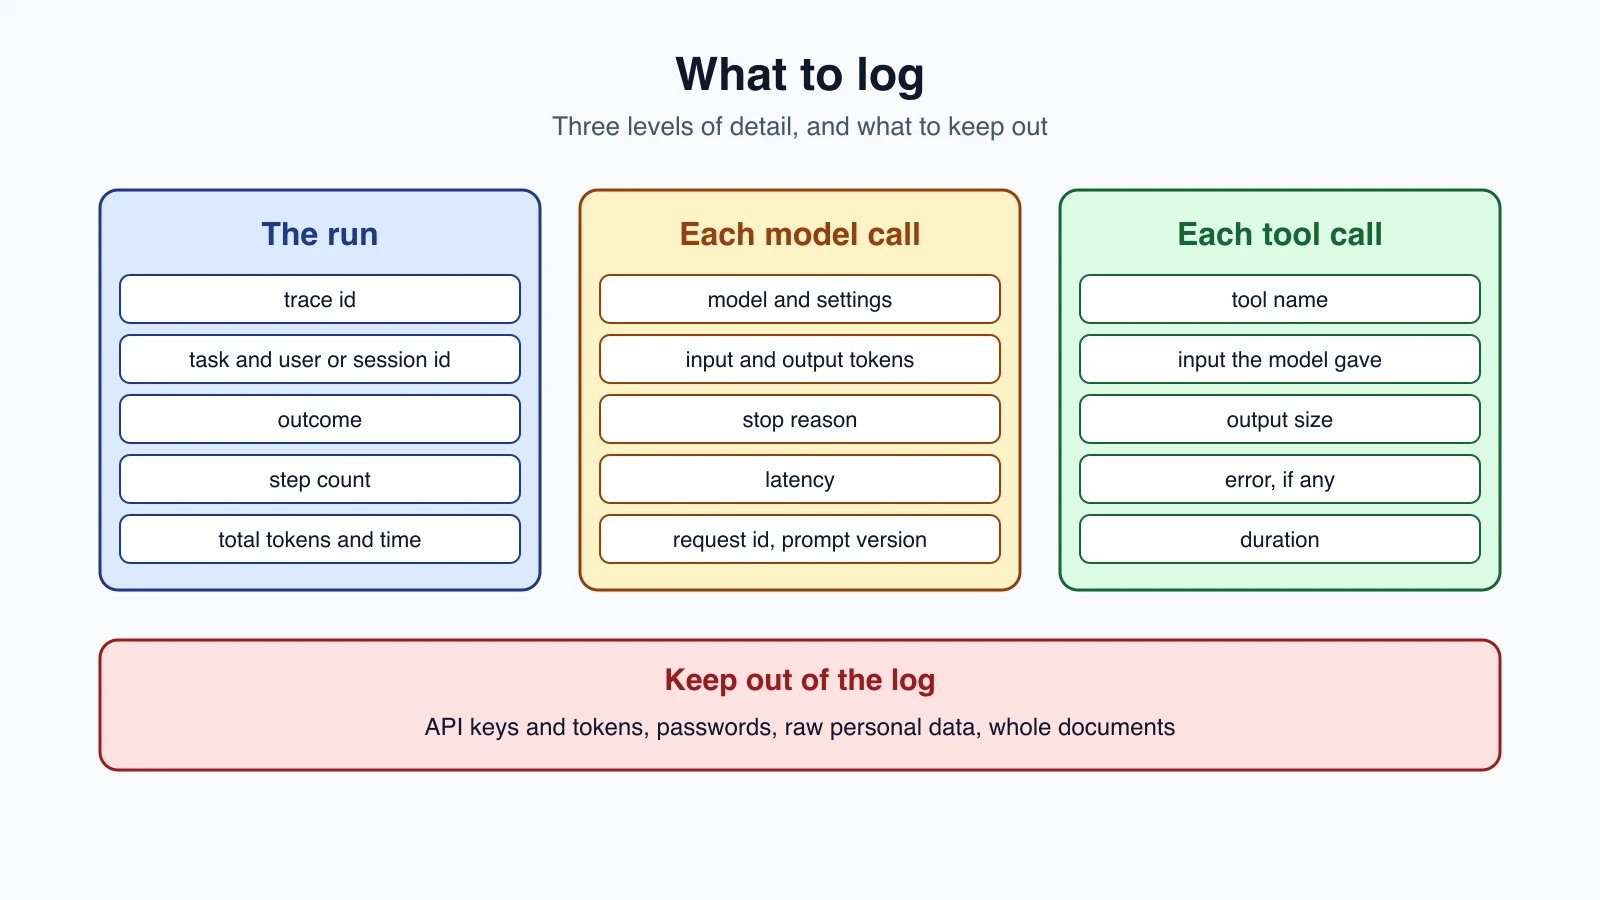
For the whole run:
- A trace id that ties every span together.
- The task or input, and a user or session id so you can follow a conversation. Prefer a pseudonymous id to a name.
- The outcome: finished, hit the step limit, failed.
- The number of steps, the total tokens and the total time.
For each model call:
- The model name and the settings you used.
- Input and output token counts. The API response reports them in
usage. - The stop reason. A
max_tokensstop explains a cut-off answer, and atool_usestop explains why the loop went on. - Latency.
- The request id. Anthropic's documentation says every API response carries a unique
request-idheader, the same value appears asrequest_idin error bodies, and the Python and TypeScript SDKs expose it as_request_idon response objects. When you contact support about one request, that id is what they ask for. - A prompt version, so you know which instructions produced which behavior.
For each tool call:
- The tool name and the input the model gave.
- The size of the output, and the output itself if it is small and safe.
- Any error, and how long it took.
What to keep out: API keys and tokens, passwords, and raw personal data. Traces are copied, stored and read by many people, so treat them as sensitive. We come back to this below, and in Privacy, bias and red teaming.
The code
Here is a small tracer in plain Python, with no libraries to install. A span is a context manager, so nesting with blocks gives you a tree. A redact function cleans every span before it is stored.
1import json
2import re
3import threading
4import time
5import uuid
6from contextlib import contextmanager
7from contextvars import ContextVar
8
9SECRET_KEY = re.compile(r"(^|[_-])(key|token|secret|password|authorization)$", re.I)  # not "input_tokens"
10EMAIL = re.compile(r"[\w.+-]+@[\w-]+\.[\w.-]+")
11
12
13def redact(value, max_chars=200):
14    """Mask secrets and emails and cut long text before anything is stored."""
15    if isinstance(value, dict):
16        return {k: "[redacted]" if SECRET_KEY.search(str(k)) else redact(v, max_chars) for k, v in value.items()}
17    if isinstance(value, list):
18        return [redact(v, max_chars) for v in value]
19    if isinstance(value, str):
20        value = EMAIL.sub("[email]", value)
21        return value if len(value) <= max_chars else f"{value[:max_chars]}...[+{len(value) - max_chars} chars]"
22    return value
23
24
25class Tracer:
26    def __init__(self):
27        self.spans = []
28        self._lock = threading.Lock()
29        self._current = ContextVar("current_span", default=None)  # shortcut: threads need contextvars.copy_context()
30
31    @contextmanager
32    def span(self, name, kind, **attrs):
33        parent = self._current.get()
34        rec = {"trace_id": parent["trace_id"] if parent else uuid.uuid4().hex[:8], "span_id": uuid.uuid4().hex[:8],
35               "parent_id": parent["span_id"] if parent else None, "name": name, "kind": kind,
36               "started": time.time(), "attrs": dict(attrs), "status": "ok", "error": None}
37        token, t0 = self._current.set(rec), time.perf_counter()
38        try:
39            yield rec
40        except Exception as exc:
41            rec["status"], rec["error"] = "error", f"{type(exc).__name__}: {exc}"
42            raise
43        finally:
44            rec["duration_ms"] = round((time.perf_counter() - t0) * 1000, 2)
45            rec["attrs"] = redact(rec["attrs"])
46            self._current.reset(token)
47            with self._lock:
48                self.spans.append(rec)
49
50    def to_jsonl(self):
51        return "\n".join(json.dumps(s, sort_keys=True) for s in self.spans)
52
53
54def show_tree(spans):
55    """One indented line per span, in the order they started."""
56    children = {}
57    for s in sorted(spans, key=lambda s: s["started"]):
58        children.setdefault(s["parent_id"], []).append(s)
59    lines = []
60
61    def walk(parent_id, depth):
62        for s in children.get(parent_id, []):
63            mark = "" if s["status"] == "ok" else f"  ERROR {s['error']}"
64            lines.append(f"{'  ' * depth}{s['kind']}:{s['name']} {s['duration_ms']}ms{mark}")
65            walk(s["span_id"], depth + 1)
66    walk(None, 0)
67    return "\n".join(lines)
68
69
70def summarize(spans):
71    llm = [s for s in spans if s["kind"] == "llm"]
72    return {"llm_calls": len(llm), "tool_calls": sum(s["kind"] == "tool" for s in spans),
73            "input_tokens": sum(s["attrs"].get("input_tokens", 0) for s in llm),
74            "output_tokens": sum(s["attrs"].get("output_tokens", 0) for s in llm),
75            "errors": [s["name"] for s in spans if s["status"] == "error"],
76            "slowest": max(spans, key=lambda s: s["duration_ms"])["name"] if spans else None}
A few design points:
- Nesting is automatic.
Tracer.spanremembers the current span in a context variable, so a span opened inside another becomes its child and shares its trace id. - Errors are recorded and re-raised. The span marks itself
errorwith the message, and the exception still reaches the caller. - Redaction happens when a span closes, so nothing sensitive is stored, even if an attribute was set late.
show_treeandsummarizeread the stored spans, one for a human looking at a single run, one for totals.- A known limit: the context variable does not follow work into a new thread. If you run tool calls in parallel threads, copy the context into each one with
contextvars.copy_context(), or your spans will lose their parent.
A bug the tests found
My first version of redact hid any attribute whose name contained the word token. That also hid input_tokens and output_tokens, the very numbers I wanted to record, and the summary crashed on a string where it expected a number. The fix was to match whole key names such as token, access_token or api_key, and not input_tokens. A test now checks that both kinds of key are handled correctly. Redaction rules are easy to get wrong in both directions, so test them.
An instrumented agent
This is the agent from Testing AI agents with spans added. Each run, model call and tool call gets one.
1MODEL = "claude-haiku-5-5"
2
3
4def run_agent(client, tools, task, tracer, max_steps=5):
5    messages = [{"role": "user", "content": task}]
6    with tracer.span("agent_run", "agent", task=task) as run:
7        for step in range(1, max_steps + 1):
8            with tracer.span("model_call", "llm", model=MODEL, step=step) as call:
9                reply = client.messages.create(model=MODEL, max_tokens=1024, messages=messages)
10                call["attrs"].update(input_tokens=reply.usage.input_tokens, output_tokens=reply.usage.output_tokens,
11                                     stop_reason=reply.stop_reason, request_id=reply._request_id)
12            tool_calls = [b for b in reply.content if b.type == "tool_use"]
13            if not tool_calls:
14                run["attrs"]["steps"] = step
15                return "".join(b.text for b in reply.content if b.type == "text")
16            results = []
17            for c in tool_calls:
18                with tracer.span(c.name, "tool", input=c.input) as s:
19                    try:
20                        results.append({"type": "tool_result", "tool_use_id": c.id, "content": str(tools[c.name](**c.input))})
21                    except Exception as exc:
22                        s["status"], s["error"] = "error", f"{type(exc).__name__}: {exc}"
23                        results.append({"type": "tool_result", "tool_use_id": c.id, "content": s["error"], "is_error": True})
24            messages.append({"role": "assistant", "content": reply.content})
25            messages.append({"role": "user", "content": results})
26        run["attrs"]["steps"] = max_steps
27        run["status"], run["error"] = "error", "max_steps reached"
28        return None
Notice what it records on each model call: the token counts, the stop reason and the request id. A failing tool sets its span to error, yet the loop continues, so the trace shows both the failure and the recovery. If the step limit is reached, the run span itself is marked as an error.
The tests
1import json, time
2from types import SimpleNamespace as NS
3import pytest
4from agent import run_agent
5from tracing import Tracer, redact, show_tree, summarize
6
7def reply(content, tin=10, tout=5, rid="req_1", stop="end_turn"):
8    return NS(content=content, usage=NS(input_tokens=tin, output_tokens=tout), stop_reason=stop, _request_id=rid)
9text = lambda t: NS(type="text", text=t)
10tool = lambda i, n, **inp: NS(type="tool_use", id=i, name=n, input=inp)
11class C:
12    def __init__(s, *r): s.messages = s; s.r = list(r)
13    def create(s, **k): return s.r.pop(0)
14
15def add(a, b): return a + b
16
17def test_redact():
18    assert redact({"api_key": "sk-123", "Authorization": "Bearer x", "n": 1}) == {"api_key": "[redacted]", "Authorization": "[redacted]", "n": 1}
19    assert redact({"x-api-key": "k", "access_token": "t", "input_tokens": 5, "max_tokens": 9}) == {"x-api-key": "[redacted]", "access_token": "[redacted]", "input_tokens": 5, "max_tokens": 9}
20    assert redact("mail ann@example.com now") == "mail [email] now"
21    assert redact("x" * 300, 50) == "x" * 50 + "...[+250 chars]"
22    assert redact({"a": [{"token": "t", "b": "ok"}]}) == {"a": [{"token": "[redacted]", "b": "ok"}]}
23
24def test_spans_nest_and_share_a_trace():
25    t = Tracer()
26    with t.span("outer", "agent"):
27        with t.span("inner", "tool"):
28            pass
29    inner, outer = t.spans
30    assert inner["parent_id"] == outer["span_id"] and inner["trace_id"] == outer["trace_id"] and outer["parent_id"] is None
31    with t.span("second", "agent"): pass
32    assert t.spans[-1]["trace_id"] != outer["trace_id"]
33
34def test_error_is_recorded_and_reraised():
35    t = Tracer()
36    with pytest.raises(ValueError):
37        with t.span("boom", "tool"): raise ValueError("bad")
38    assert t.spans[0]["status"] == "error" and t.spans[0]["error"] == "ValueError: bad"
39
40def test_attrs_are_redacted_on_close():
41    t = Tracer()
42    with t.span("s", "tool", api_key="sk-1", note="a@b.co"): pass
43    assert t.spans[0]["attrs"] == {"api_key": "[redacted]", "note": "[email]"}
44
45def test_traced_agent_run():
46    t = Tracer()
47    c = C(reply([tool("t1", "add", a=2, b=3)], tin=100, tout=20, rid="req_a", stop="tool_use"), reply([text("5")], tin=150, tout=10, rid="req_b"))
48    assert run_agent(c, {"add": add}, "2+3?", t) == "5"
49    s = summarize(t.spans)
50    assert s["llm_calls"] == 2 and s["tool_calls"] == 1 and s["input_tokens"] == 250 and s["output_tokens"] == 30 and s["errors"] == []
51    llm = [x for x in t.spans if x["kind"] == "llm"]
52    assert [x["attrs"]["request_id"] for x in llm] == ["req_a", "req_b"] and llm[0]["attrs"]["stop_reason"] == "tool_use"
53    assert len({x["trace_id"] for x in t.spans}) == 1
54    run = next(x for x in t.spans if x["kind"] == "agent")
55    assert run["attrs"]["steps"] == 2 and all(x["parent_id"] == run["span_id"] for x in t.spans if x is not run)
56    assert show_tree(t.spans).splitlines()[0].startswith("agent:agent_run") and "  tool:add" in show_tree(t.spans)
57
58def test_tool_error_shows_in_trace_and_agent_continues():
59    t = Tracer()
60    c = C(reply([tool("t1", "add", a=1)], stop="tool_use"), reply([text("sorry")]))
61    assert run_agent(c, {"add": add}, "x", t) == "sorry"
62    assert summarize(t.spans)["errors"] == ["add"] and "ERROR TypeError" in show_tree(t.spans)
63
64def test_max_steps_marks_the_run_as_failed():
65    t = Tracer()
66    c = C(*[reply([tool(f"t{i}", "add", a=1, b=1)], stop="tool_use") for i in range(5)])
67    assert run_agent(c, {"add": add}, "x", t, max_steps=2) is None
68    assert "agent_run" in summarize(t.spans)["errors"]
69
70def test_secrets_in_tool_input_never_reach_the_log():
71    t = Tracer()
72    c = C(reply([tool("t1", "login", api_key="sk-SECRET", user="a@b.co")], stop="tool_use"), reply([text("ok")]))
73    run_agent(c, {"login": lambda **k: "in"}, "x", t)
74    assert "sk-SECRET" not in t.to_jsonl() and "a@b.co" not in t.to_jsonl()
75    assert all(json.loads(l) for l in t.to_jsonl().splitlines())
76
77def test_summarize_empty():
78    assert summarize([])["slowest"] is None
They use a fake client, so no API key is needed. I broke the tracer four ways to check that the tests notice: skipping redaction, dropping the parent link, not recording errors, and not resetting the current span. Each change made at least one test fail.
What a trace looks like
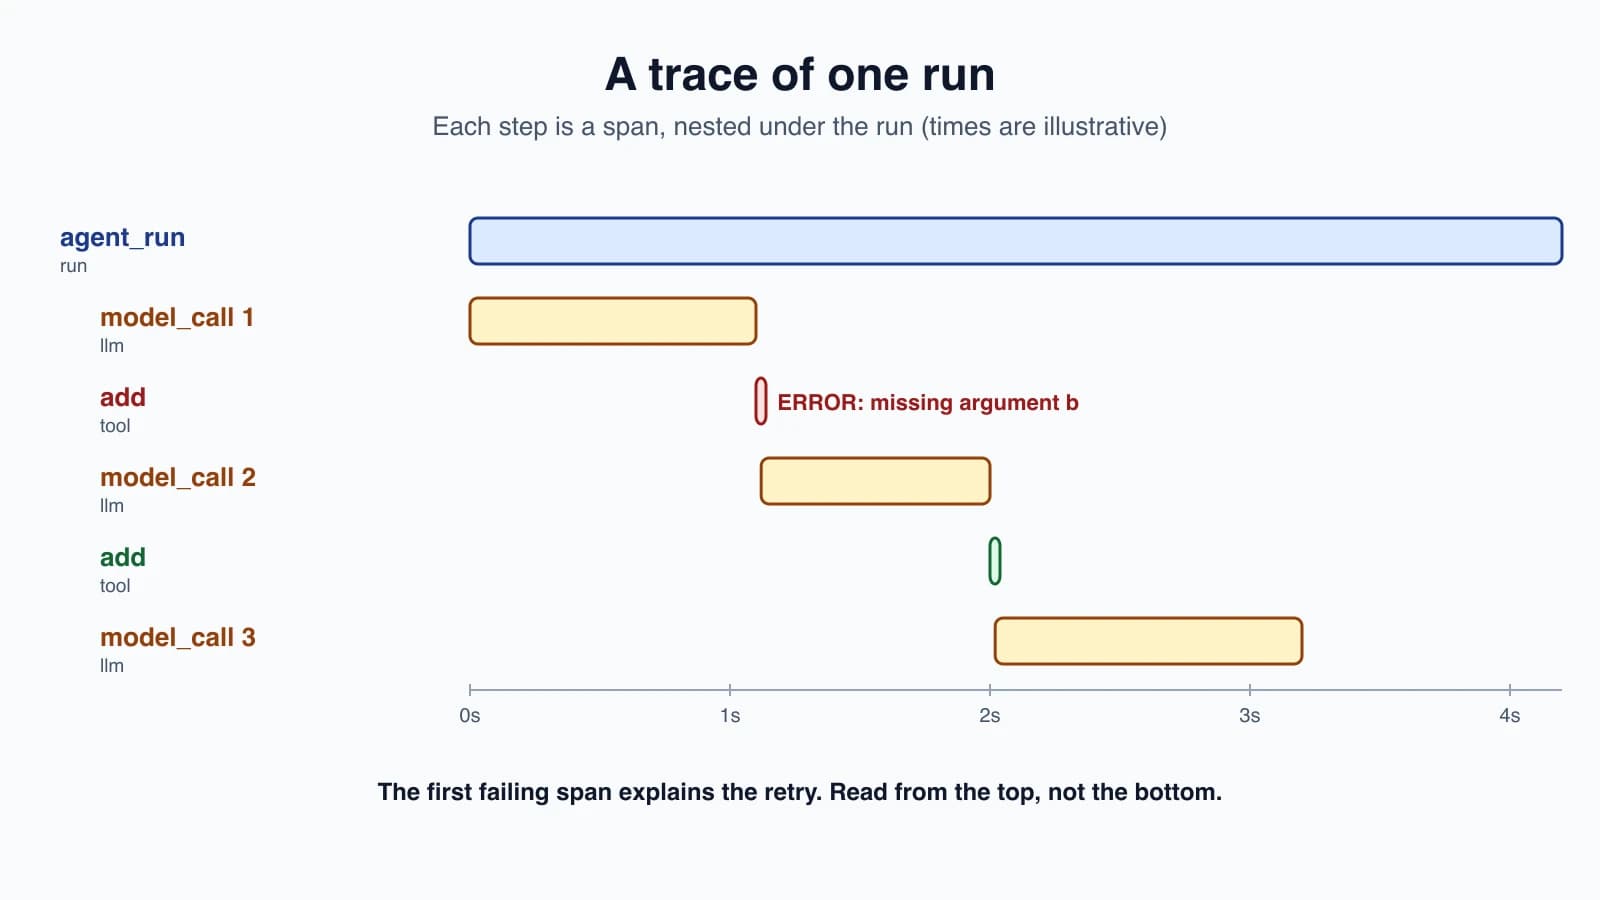
This is the output of show_tree for a run in which the model first calls add with a missing argument, then tries again. The model is a fake, so the times are close to zero. In real runs each line carries real times.
1agent:agent_run 0.06ms
2  llm:model_call 0.0ms
3  tool:add 0.0ms  ERROR TypeError: add() missing 1 required positional argument: 'b'
4  llm:model_call 0.0ms
5  tool:add 0.0ms
6  llm:model_call 0.0ms
Even this tiny trace tells a story: the first tool call failed, the model saw the error, called the tool again correctly, and then answered. Without the trace, you would see only the final answer.
Debug a failure from a trace
When a run goes wrong, work through it in a fixed order:
- Find the run. Search by trace id, user, outcome or error.
- Read the tree from the top. How many steps? Did it loop? Did it end at the step limit?
- Find the first strange span, not the last one. The final error is often a symptom of an earlier bad choice.
- Open that span's input and output. What did the model see? Was a tool result empty, huge or misleading?
- Decide the cause: an unclear tool description, a tool that returned too little, a missing instruction, a bug in your code, or a model slip.
- Reproduce it as a loop test with a scripted reply, as in Testing AI agents, so it stays fixed.
- Add it to your eval set, as in Evaluating AI agents, so you measure improvement.
This is how most of your best test cases will arrive: from real traces of real failures.
Monitoring in production
One trace helps with one run. A running agent needs numbers across all runs. Track:
- Success rate by outcome: finished, step limit, error.
- Latency, as a median and a slow tail such as the 95th percentile. Averages hide the slow runs users notice.
- Tokens and cost per run. A sudden rise often means a loop or a longer prompt.
- Steps per run. A climb can mean the agent is struggling.
- Tool error rate, per tool.
- API errors and rate limits, such as 429 and 529, as in Errors, retries and rate limits.
- Stop reasons, especially cut-offs at the token limit.
- Quality signals: user feedback, and scores from sampled evaluations.
Set alerts on the ones that matter, such as error rate above a limit or cost per run doubling. Dashboards are for looking, alerts are for waking someone up.
Sampling and retention
Storing every detail of every run gets expensive. A common approach is to keep every error and every slow run in full, and sample the rest. Decide how long to keep traces, and delete them on schedule. Traces can contain user text, so a long retention period raises your privacy risk.
Privacy and safety of traces
- Redact before storing, as the code does. Secrets, tokens and obvious personal data such as email addresses.
- Cut long text. Full documents in traces are costly and risky.
- Control who can read traces, since they may contain customer messages.
- Mind where the data goes. A hosted tracing service receives whatever you send. Check what it stores, where, and for how long, before you send real user data.
- Remember that tool results can hold hostile text, and that traces will faithfully record it. See Prompt injection and tool sandboxing.
Tools that do this for you
You can write your own tracer, as above, and it is a fine way to learn. For production, several tools exist. Here is what their own documentation says, as read for this lesson. Features change quickly, so check the current docs before choosing.
| Tool | What it is | How it connects |
|---|---|---|
| OpenTelemetry | The open standard for traces, metrics and logs, used well beyond AI | Its generative AI conventions live in a separate repository, so check it for the current span and attribute names |
| OpenLLMetry | Open source (Apache 2.0), built on OpenTelemetry, from Traceloop | Instruments providers including Anthropic and OpenAI and vector databases. Start with Traceloop.init() after pip install traceloop-sdk. Data can go to your existing observability backend |
| Langfuse | Open source and self-hostable | Records each request with prompts, responses, token use, latency, and tool and retrieval steps as nested observations. Also tracks cost, scores, dashboards and alerts. SDKs send data in the background in batches so they do not block your responses |
| LangSmith | A hosted platform from the makers of LangChain | Tracing can be set up with environment variables, framework integrations or its SDK, with integrations listed for OpenAI, Anthropic and others. Dashboards, alerts and online evaluations |
| Helicone | An observability platform and AI gateway | Works as a gateway: you point your SDK's base URL at it and your requests are logged. Its documentation example uses an OpenAI-compatible endpoint, so check how it supports the provider you use |
How to choose:
- Already use OpenTelemetry? Look at OpenLLMetry, so agent traces sit beside your other traces.
- Want to self-host to keep data in house? Langfuse is open source and self-hostable.
- Use LangChain or LangGraph? LangSmith fits naturally, though its documentation lists other integrations too.
- Want the least code? A gateway such as Helicone changes one setting, at the price of routing your traffic through it.
Whatever you pick, the ideas in this lesson stay the same: trace each run, record the same fields, redact, and read the tree.
Mistakes beginners make
- No traces, so failures cannot be explained.
- Logging only the final answer.
- Logging everything, including secrets and raw personal data.
- Redacting too much, and hiding the numbers you need.
- No request id, so support cannot find your call.
- Reading the last error and not the first strange span.
- Averages only, which hide slow runs.
- No alerts, so problems are found by users.
- Sending real user data to a hosted tool without checking its policies.
- Never turning failures into tests.
Quick recap
- Agents fail in ways a stack trace cannot explain, so record what they did and why.
- A trace is one run, and spans are its steps: the run, each model call and each tool call, linked as a tree.
- Log tokens, stop reason, latency and request id for model calls, and name, input, error and duration for tools.
- Redact secrets and personal data before storing, and test your redaction.
- Debug by finding the first strange span, then reproduce it as a test and add it to your evals.
- In production, watch success rate, tail latency, cost, steps, tool errors and rate limits, with alerts and sampling.
- OpenTelemetry, OpenLLMetry, Langfuse, LangSmith and Helicone can do the work, but check their current documentation and data policies.
Try it yourself
Run the tracer on the instrumented agent with a fake client that makes one tool call fail. Print show_tree and summarize, then dump to_jsonl. Add a new attribute, such as a prompt version, to each model call. Add a secret-looking attribute and confirm that it never appears in the output. Finally, take one trace and write the loop test that reproduces its failure.
Next lesson: Prompt injection and tool sandboxing.