
Cyber Security course · lesson 7 of 24
- 1What Is Cyber Security?
- 2Fundamental IT Skills for Cyber Security
- 3Operating Systems for Security: Windows, Linux and macOS
- 4Virtualization and Your Safe Cyber Security Lab
- 5Networking Fundamentals for Cyber Security
- 6Network Services and Infrastructure for Cyber Security
- 7Network Troubleshooting and Traffic Analysis Tools
- 8Core Security Concepts Every Defender Uses
- 9Authentication and Access Control Explained
- 10Cryptography Basics for Cyber Security
- 11Secure Protocols and Wireless Security
- 12The Threat Landscape and Security Frameworks
- 13Social Engineering and Human Attacks
- 14Network and Wireless Attacks and How to Detect Them
- 15Web Attacks and the OWASP Top 10
- 16Malware, Exploits and System Attacks
- 17Hardening and Endpoint Security
- 18Network Defense, Logging and SIEM
- 19Vulnerability Management and Threat Hunting
- 20Incident Response and Digital Forensics
- 21Cloud Security Basics
- 22Scripting for Security
- 23Ethical Hacking, CTFs and Penetration Testing
- 24Cyber Security Standards, Certifications and Capstone
After this lesson, you should be able to choose the right tool for a network question, from "is it up?" to "what is actually on the wire?", use ping, traceroute, dig, nslookup, ipconfig, ip, netstat, lsof, arp and route, read a firewall rule listing, explain what a port scanner does and how nmap reports port states, capture and filter packets with tcpdump and Wireshark, and run a small Python port checker that refuses to scan anything outside your lab. These are the tools defenders reach for first when something is wrong, and the same tools attackers use to map a network. The difference is permission.
Permission first
Every scan and capture in this lesson targets your own lab from Virtualization and Your Safe Cyber Security Lab or your own computer. Nmap's own documentation on legal issues advises getting written permission before scanning any network you do not own, warns that unauthorized scans can lead your internet provider to warn you or end your service, and notes that some providers ban unauthorized port scanning outright. Capturing other people's traffic can also break interception and privacy laws, separately from computer misuse laws.
So, in this course: scan only harbor-server and harbor-kali, capture only on the lab network or your own machine, and never point these tools at your school, employer, neighbor or a website "just to see". Watching your own traffic on your own computer is how you learn; watching anyone else's is not yours to decide.
A method for network problems
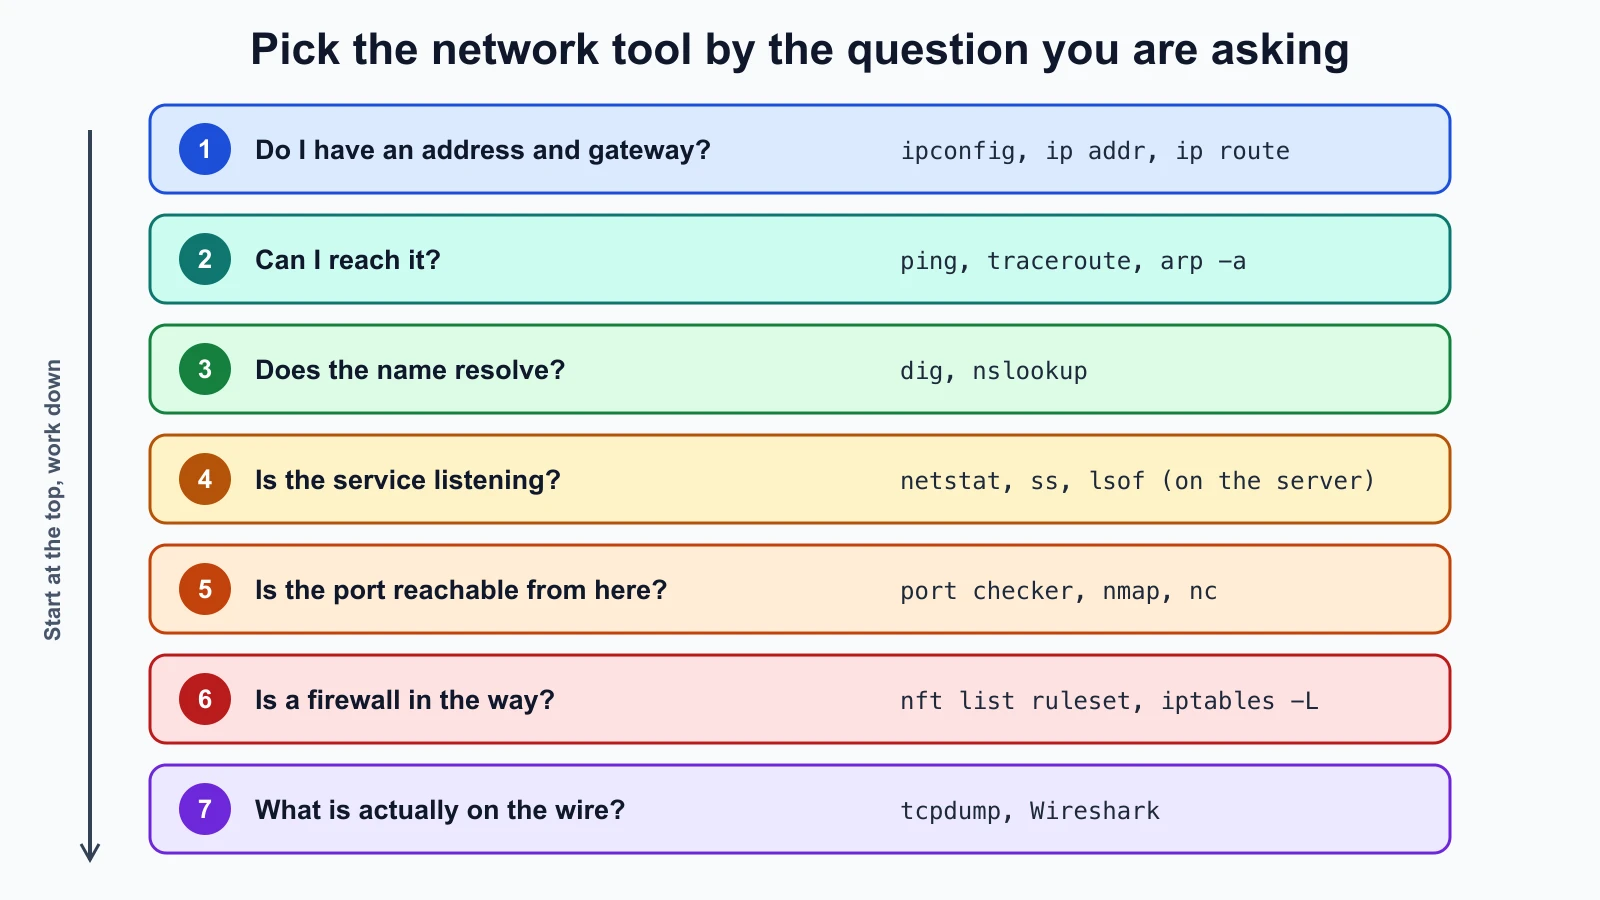
The seven-step troubleshooting method from Fundamental IT Skills for Cyber Security still applies. For networks, it helps to work up the layers from Networking Fundamentals for Cyber Security, asking one question at each step:
| Question | Layer | Tools |
|---|---|---|
| Do I have an address and a gateway? | 3 | ipconfig (Windows), ip addr, ip route (Linux), ifconfig, route -n get default (macOS) |
| Can I reach the gateway and beyond? | 3 | ping, traceroute or tracert, arp -a |
| Does the name resolve? | 7 | dig, nslookup |
| Is the service listening? | 4 | netstat, ss, lsof on the server |
| Is the port reachable from here? | 4 | A port checker, nmap, nc |
| Is a firewall in the way? | 3 and 4 | nft list ruleset, iptables -L, Windows Defender Firewall |
| What is actually being sent? | All | tcpdump, Wireshark |
Most problems are found in the first three rows. The later rows are where security work spends more time.
Reachability: ping and traceroute
ping sends an ICMP Echo request (type 8 in RFC 792, the ICMP standard) and waits for an Echo Reply (type 0). A reply proves the target is up and reachable and gives the round-trip time. You saw a loopback ping in the networking fundamentals lesson. Two cautions apply. A failed ping does not prove a machine is down, because many firewalls block ICMP. And a successful ping says nothing about whether a particular service works. On Linux and macOS, ping -c 4 address sends four requests and stops; on Windows, ping sends four by default.
traceroute (tracert on Windows) shows the path packets take. It sends probes with a time-to-live (TTL) of 1, then 2, then 3, and so on. Each router that drops a probe because its TTL ran out should send back an ICMP Time Exceeded message (type 11), which reveals that router's address and how long the round trip took. Each line of output is one hop. The FreeBSD manual explains that a * means a probe got no answer within the timeout, often because a router does not send those messages at all. A row of stars in the middle of a trace is normal; a trace that stops for good at one hop points at where traffic is blocked.
Defenders use traceroute to see where traffic leaves their network and whether it takes an unexpected path. In the lab, traceroute from harbor-kali to harbor-server shows a single hop, because both are on the same subnet with no router between them.
Names: dig and nslookup
You met dig in the network services lesson. For troubleshooting, two habits help. First, ask a specific resolver to compare answers: dig @1.1.1.1 example.com asks a public resolver, while plain dig example.com asks whatever your system uses. If they disagree, something between you and the internet is changing DNS answers, which can be a misconfiguration or an attack. Second, read the TTL: a very short TTL on a domain that normally has a long one can be a sign of a domain that changes its addresses often, which some malicious infrastructure does. On Windows, nslookup example.com 1.1.1.1 does the same job.
Local state: addresses, routes, ARP and listening ports
These commands show what your own machine believes about the network:
- Addresses and routes:
ipconfig /allon Windows,ip addrandip routeon Linux,ifconfigandnetstat -rnon macOS. Check the address, the mask, the default gateway and the DNS servers. A wrong gateway or DNS server, handed out by a rogue DHCP server, shows up here. - ARP table:
arp -aon all three systems lists the IP and MAC address pairs your machine has learned. If two different IP addresses map to the same MAC address, and one of them is your gateway, someone may be ARP spoofing. - Listening ports and connections:
netstat -anon all three systems,ss -tulpnon Linux, orlsof -iTCP -sTCP:LISTEN -P -non macOS and Linux. These answer "which programs are waiting for connections, and on which address?"
Here is real output from a Mac with two small test servers started on purpose, filtered to just those two (the username is replaced with harbor):
1lsof -nP -iTCP -sTCP:LISTEN
2netstat -an -p tcp1COMMAND PID USER FD TYPE DEVICE SIZE/OFF NODE NAME
2Python 88440 harbor 3u IPv4 0xacfe34f086632479 0t0 TCP 127.0.0.1:2222 (LISTEN)
3Python 88440 harbor 4u IPv4 0x4aae41a75eb5aa3c 0t0 TCP 127.0.0.1:8080 (LISTEN)
4
5Proto Recv-Q Send-Q Local Address Foreign Address (state)
6tcp4 0 0 127.0.0.1.8080 *.* LISTEN
7tcp4 0 0 127.0.0.1.2222 *.* LISTENlsof names the program and process ID that owns each port, which netstat on macOS does not. Both show the servers listening on 127.0.0.1, so they are reachable only from the same machine, exactly as the loopback section of the networking fundamentals lesson described. On a server, a listener on 0.0.0.0 or * that you did not expect is worth investigating: it is reachable from the network.
Firewalls: reading the rules
A host firewall decides which packets a machine accepts. On Linux the classic tool is iptables. Debian's documentation explains that nftables has been Debian's default firewall framework since Debian 10, and that the iptables command now normally runs on top of nftables through a compatibility layer, so you may meet either. To read the current rules on a Linux lab VM:
1sudo nft list ruleset
2sudo iptables -L -n -v
An empty ruleset means the host accepts everything. On Windows, Windows Defender Firewall holds the rules; on macOS, the application firewall is under System Settings. You will write firewall rules in the hardening lesson. In this lesson, the point is to check them when a port that should be reachable is not, or when one that should be blocked is reachable.
Port scanning
A port scanner tries to connect to a list of ports on a target and reports which respond. Defenders scan their own machines to find services they did not know were exposed; attackers scan to find a way in. The technique is the same, which is why permission decides which one you are doing.
Nmap
Nmap is a widely used network scanner. It is free and open source, and it is preinstalled on Kali. Its documentation lists six port states; the three you will see most are:
- open: a service is accepting connections on the port.
- closed: the port responds, but nothing is listening.
- filtered: something, usually a firewall, blocks the probes, so Nmap cannot tell whether the port is open.
Some common options, as described in Nmap's reference guide:
| Option | What it does |
|---|---|
-sn | Host discovery only: which addresses are up, with no port scan |
-sT | TCP connect scan, completing a normal connection to each port |
-sS | TCP SYN scan, which needs raw packet privileges (root on Unix); without them Nmap falls back to a connect scan |
-p 22,80,443 | Scan only these ports |
-sV | Probe open ports to identify the service and version |
-Pn | Skip host discovery and treat the target as up |
-oN file.txt | Save results in normal format |
In the lab, with harbor-server at an address such as 192.168.56.10 (yours may differ; check with ip addr), a careful first session from harbor-kali looks like this. These commands follow the Nmap documentation and were not run for this lesson:
1nmap -sn 192.168.56.0/24
2nmap -sT -p 1-1024 192.168.56.10 -oN harbor-server-scan.txt
3nmap -sV -p 22 192.168.56.10
The first finds live machines on the lab subnet. The second checks the first 1,024 ports on the server and saves the result. The third asks what is running on port 22. On a fresh Ubuntu Server with SSH installed, you would expect 22 to be open and little else. Anything more is either something you installed or something to explain.
A small, tested port checker
Writing a basic checker yourself shows what a scanner does underneath, and gives you a tool you can read line by line. This Python script tries a full TCP connection to each port, reads the first line the service sends (its banner, which often names the software), and refuses to run against anything that is not a loopback or private address. That refusal is a safety rail for practice, not a legal permission check: a private address can still belong to someone else's network, so the permission rule above still applies.
1# lab_port_check.py
2import argparse
3import ipaddress
4import socket
5
6LAB_NETWORKS = [ipaddress.ip_network(n) for n in ("127.0.0.0/8", "10.0.0.0/8", "172.16.0.0/12", "192.168.0.0/16")]
7
8
9def is_lab_address(host: str) -> bool:
10    try:
11        address = ipaddress.ip_address(host)
12    except ValueError:
13        return False
14    return any(address in network for network in LAB_NETWORKS)
15
16
17def check_port(host: str, port: int, timeout: float = 1.0) -> dict:
18    result = {"port": port, "state": "closed", "banner": ""}
19    try:
20        with socket.create_connection((host, port), timeout=timeout) as conn:
21            result["state"] = "open"
22            conn.settimeout(timeout)
23            try:
24                result["banner"] = conn.recv(200).decode("utf-8", "replace").strip()
25            except socket.timeout:
26                pass
27    except socket.timeout:
28        result["state"] = "no reply"
29    except ConnectionRefusedError:
30        result["state"] = "closed"
31    except OSError:
32        result["state"] = "no reply"
33    return result
34
35
36def parse_ports(text: str) -> list[int]:
37    ports = set()
38    for part in text.split(","):
39        if "-" in part:
40            low, high = (int(p) for p in part.split("-", 1))
41            ports.update(range(low, high + 1))
42        else:
43            ports.add(int(part))
44    if not ports or min(ports) < 1 or max(ports) > 65535 or len(ports) > 1024:
45        raise ValueError("ports must be 1-65535, at most 1024 of them")
46    return sorted(ports)
47
48
49def main() -> None:
50    parser = argparse.ArgumentParser(description="Check TCP ports on a lab machine you own.")
51    parser.add_argument("host", help="IP address of a machine in your own lab")
52    parser.add_argument("ports", help="for example 22,80,443 or 20-25")
53    parser.add_argument("--timeout", type=float, default=1.0)
54    args = parser.parse_args()
55    if not is_lab_address(args.host):
56        raise SystemExit("Refusing: only loopback and private lab addresses are allowed.")
57    for port in parse_ports(args.ports):
58        r = check_port(args.host, port, args.timeout)
59        print(f"{port:>5}  {r['state']:<9} {r['banner']}")
60
61
62if __name__ == "__main__":
63    main()
How it maps to Nmap's states: a completed connection is open; an immediate refusal is closed; a timeout or no answer is reported as no reply, which is what Nmap would call filtered. The script accepts only IP addresses, not names, so a name cannot quietly resolve to someone else's server. It also caps a run at 1,024 ports to keep scans small.
To try it on your own computer, two small test servers were started on 127.0.0.1: one on port 2222 that sends an SSH-style banner, and one on 8080 that sends nothing. Port 9999 had nothing listening. With Python 3.12 on a Mac:
1python3 lab_port_check.py 127.0.0.1 2222,8080,9999 --timeout 0.5
2python3 lab_port_check.py 203.0.113.10 801 2222 open SSH-2.0-HarborLab_1.0
2 8080 open
3 9999 closed
4Refusing: only loopback and private lab addresses are allowed.In the lab, python3 lab_port_check.py 192.168.56.10 22,80,443 from harbor-kali should show port 22 open with a banner starting SSH-2.0-, because SSH servers announce their version as soon as you connect. That banner is useful to you, and equally useful to an attacker checking for old versions, which is one reason to keep software updated.
These tests start real listeners on 127.0.0.1, so they need no lab and touch no network. Save them as lab_port_check_test.py beside the script and run python3 -m unittest discover -p '*_test.py':
1# lab_port_check_test.py
2import socket
3import threading
4import unittest
5
6from lab_port_check import check_port, is_lab_address, parse_ports
7
8
9def start_server(banner: bytes) -> tuple[socket.socket, int]:
10    server = socket.socket()
11    server.bind(("127.0.0.1", 0))
12    server.listen()
13
14    def serve() -> None:
15        try:
16            conn, _ = server.accept()
17        except OSError:
18            return
19        with conn:
20            if banner:
21                conn.sendall(banner)
22            conn.recv(1)
23
24    threading.Thread(target=serve, daemon=True).start()
25    return server, server.getsockname()[1]
26
27
28def free_port() -> int:
29    s = socket.socket()
30    s.bind(("127.0.0.1", 0))
31    port = s.getsockname()[1]
32    s.close()
33    return port
34
35
36class PortCheckTest(unittest.TestCase):
37    def test_open_port_with_banner(self):
38        server, port = start_server(b"SSH-2.0-LabServer\r\n")
39        with server:
40            r = check_port("127.0.0.1", port)
41        self.assertEqual(r["state"], "open")
42        self.assertEqual(r["banner"], "SSH-2.0-LabServer")
43
44    def test_open_port_without_banner(self):
45        server, port = start_server(b"")
46        with server:
47            r = check_port("127.0.0.1", port, timeout=0.3)
48        self.assertEqual(r["state"], "open")
49        self.assertEqual(r["banner"], "")
50
51    def test_closed_port(self):
52        self.assertEqual(check_port("127.0.0.1", free_port())["state"], "closed")
53
54    def test_only_lab_addresses_allowed(self):
55        self.assertTrue(is_lab_address("127.0.0.1"))
56        self.assertTrue(is_lab_address("192.168.56.10"))
57        self.assertFalse(is_lab_address("203.0.113.10"))
58        self.assertFalse(is_lab_address("example.com"))
59
60    def test_parse_ports(self):
61        self.assertEqual(parse_ports("22,80,20-23"), [20, 21, 22, 23, 80])
62        with self.assertRaises(ValueError):
63            parse_ports("0-10")
64        with self.assertRaises(ValueError):
65            parse_ports("1-2000")
66
67
68if __name__ == "__main__":
69    unittest.main()
All five tests passed with Python 3.12. To check the tests themselves, four deliberate bugs were introduced one at a time: reporting open ports as closed, accepting an address only if it is in every lab range instead of any, raising the port cap to 4,096, and lowercasing banners instead of trimming them. Each made at least one test fail, and all passed again once the bug was removed.
Seeing packets: tcpdump and Wireshark
A packet sniffer captures packets as they pass a network interface. A protocol analyzer decodes them into readable fields: addresses, ports, flags and the protocol's own messages. tcpdump does both on the command line; Wireshark does both with a graphical interface. Wireshark's user guide describes it as a network packet analyzer, and is clear about what it is not: it is not an intrusion detection system and does not alert you to attacks, and it only observes traffic rather than changing it.
Capturing live traffic usually needs administrator rights, because it reads every packet on an interface. The tcpdump manual notes that reading packets from an interface may need special privileges, while reading a saved capture file does not. Captures are saved in pcap format, which both tools read.
Useful tcpdump options from its manual: -i chooses the interface, -n shows numbers instead of looking up names, -c stops after a number of packets, -w file.pcap saves the capture, and -r file.pcap reads it back. A filter expression at the end narrows what is shown. In the lab, on harbor-kali:
1sudo tcpdump -i eth0 -n -c 50 -w lab.pcap host 192.168.56.10
2tcpdump -n -r lab.pcap 'tcp port 22'
Those two lines follow the manual and were not run here. The interface name eth0 is common on Kali but may differ on yours; ip addr lists them.
Why plaintext protocols are dangerous
The network services lesson said FTP sends passwords as readable text. This is what that looks like. The capture below is synthetic: a short Python script wrote the packets of an FTP login between two lab addresses into a pcap file, with a made-up user and password, and tcpdump 4.99.1 read the file. No real network or account was involved. The output is real tcpdump output of that file, shown in UTC:
1tcpdump -r ftp-login-lab.pcap -n1reading from file ftp-login-lab.pcap, link-type EN10MB (Ethernet)
208:00:00.000000 IP 192.168.56.20.50000 > 192.168.56.10.21: Flags [S], seq 1000, win 64240, length 0
308:00:00.001000 IP 192.168.56.10.21 > 192.168.56.20.50000: Flags [S.], seq 5000, ack 1001, win 64240, length 0
408:00:00.002000 IP 192.168.56.20.50000 > 192.168.56.10.21: Flags [.], ack 1, win 64240, length 0
508:00:00.003000 IP 192.168.56.10.21 > 192.168.56.20.50000: Flags [P.], seq 1:27, ack 1, win 64240, length 26: FTP: 220 Harbor lab FTP ready
608:00:00.004000 IP 192.168.56.20.50000 > 192.168.56.10.21: Flags [P.], seq 1:19, ack 27, win 64240, length 18: FTP: USER harborstaff
708:00:00.005000 IP 192.168.56.10.21 > 192.168.56.20.50000: Flags [P.], seq 27:50, ack 19, win 64240, length 23: FTP: 331 Password required
808:00:00.006000 IP 192.168.56.20.50000 > 192.168.56.10.21: Flags [P.], seq 19:43, ack 50, win 64240, length 24: FTP: PASS Summer-Books-2026
908:00:00.007000 IP 192.168.56.10.21 > 192.168.56.20.50000: Flags [P.], seq 50:72, ack 43, win 64240, length 22: FTP: 230 Login successfulRead one line from left to right: time, IP, source address and port, >, destination address and port, TCP flags, sequence numbers and length, and then, because tcpdump understands FTP, the FTP message itself. The flags tell the story of a TCP connection: [S] is a SYN (the client asks to connect), [S.] is SYN plus ACK (the server agrees), [.] is an ACK (the client confirms). That exchange is the TCP three-way handshake, and after it the data flows with [P.] (push and acknowledge).
Then look at lines five and seven. The user name and password are right there. Anyone who can capture traffic on that network segment, for example with ARP spoofing on a shared Wi-Fi, can read them. With SFTP or any TLS-protected protocol, a capture shows the handshake and then only encrypted bytes.
Filters narrow a capture. This filter, from the same file, shows only packets with the SYN flag set, which is how you would spot new connection attempts, or a scan:
1tcpdump -r ftp-login-lab.pcap -n 'tcp[tcpflags] & tcp-syn != 0'1reading from file ftp-login-lab.pcap, link-type EN10MB (Ethernet)
208:00:00.000000 IP 192.168.56.20.50000 > 192.168.56.10.21: Flags [S], seq 1000, win 64240, length 0
308:00:00.001000 IP 192.168.56.10.21 > 192.168.56.20.50000: Flags [S.], seq 5000, ack 1001, win 64240, length 0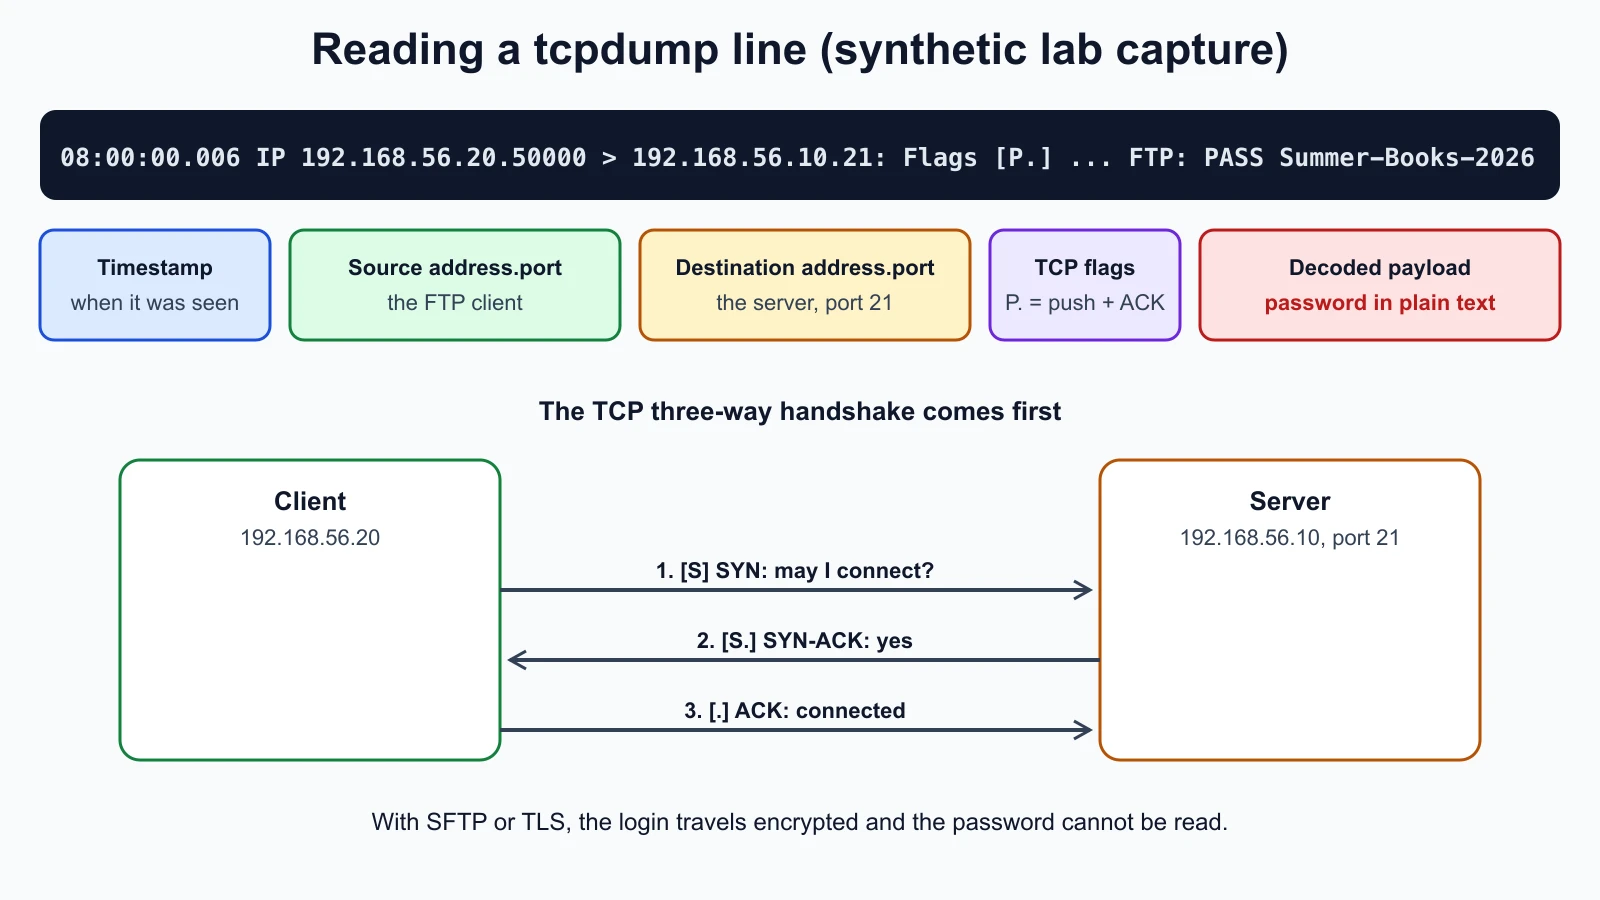
Wireshark in short
Wireshark shows the same packets in three panes: a list of packets, the decoded fields of the selected packet, and its raw bytes. Its most useful features for beginners are display filters, typed in the bar at the top, such as ftp, dns, tcp.port == 22 or ip.addr == 192.168.56.10, and Follow TCP Stream, which reassembles one conversation so you can read it as text. Open the lab capture you make with tcpdump in Wireshark and compare the two views. Kali includes Wireshark; on your own computer, install it only from wireshark.org or your package manager.
Mistakes beginners make
-
Scanning or capturing outside the lab. Curiosity about the office network or a website can break the law and your provider's terms.
Fix: Point every tool at your lab VMs or your own machine, and get written permission for anything else.
-
Treating a failed ping as "the host is down". ICMP is often blocked.
Fix: Check the service directly with a port check before concluding.
-
Running huge scans by default. Scanning every port on a whole network is slow, noisy and rarely needed.
Fix: Start with host discovery, then scan the specific ports that matter, and save the results.
-
Capturing everything and reading nothing. Large captures overwhelm beginners.
Fix: Capture with a host or port filter and a packet count, then use display filters to narrow further.
-
Believing a banner without checking. Banners can be changed or faked.
Fix: Use a banner as a clue and confirm the version on the machine itself when you can.
Recap and try it yourself
Network troubleshooting works up the layers: address and gateway (ipconfig, ip), reachability (ping, traceroute), names (dig, nslookup), listening services (netstat, ss, lsof), reachable ports (a port checker or nmap), firewalls (nft, iptables), and finally the wire (tcpdump, Wireshark). Nmap reports ports as open, closed or filtered, and its SYN scan needs administrator rights. The Python checker in this lesson does a full connection, reads banners and refuses non-lab addresses. A packet capture shows the TCP handshake and, for plaintext protocols such as FTP, the passwords themselves. Every one of these tools needs permission when pointed at anything you do not own.
Try it in your lab:
- On
harbor-kali, runip addr,ip routeandarp -a. Write down your address, gateway and the MAC address ofharbor-server. - Run
ping -c 4andtraceroutetoharbor-server. How many hops are there, and why? - Save the port checker and its tests, run the tests, then check ports 22, 80 and 443 on
harbor-server. Compare withnmap -sT -p 22,80,443against the same address. - On
harbor-server, runsudo ss -tulpnand match each listening port to what the scans found. - Start
sudo tcpdump -i eth0 -n -c 20 hostfollowed byharbor-server's address onharbor-kali, then SSH fromharbor-kalitoharbor-serverin another terminal. Find the three-way handshake in the output, and notice that after it you cannot read anything, because SSH is encrypted.
Record what you found in your lab notes. That completes the networking module. Next, the course moves to core security concepts: defense in depth, zero trust, risk, segmentation and how to tell a true alert from a false one.
Sources checked on 12 November 2026: Nmap, legal issues; Nmap, port scanning basics; Nmap, options summary; Nmap, port scanning techniques; RFC 792, ICMP; FreeBSD traceroute manual; Debian wiki, nftables; tcpdump manual; Wireshark user guide, introduction; Python socket module.