
MLOps course · lesson 20 of 24
- 1What Is MLOps? From Notebooks to Reliable Production
- 2MLOps Principles and Maturity: From Manual to Automated
- 3ML Fundamentals for MLOps: Splits, Leakage, and Metrics
- 4A Reproducible ML Project: Layout, Seeds, and Data Code
- 5Data Engineering Basics for ML: Ingestion, SQL, and Skew
- 6Pipeline Orchestration: Apache Airflow and Kubeflow
- 7Batch vs Streaming: Spark, Kafka, and Flink
- 8Data Versioning and Lineage: DVC and Beyond
- 9Data Validation and Quality in ML Pipelines
- 10Experiment Tracking with MLflow
- 11Reproducible Training Pipelines
- 12Model Evaluation and Validation Gates
- 13Model Registry and Versioning
- 14CI/CD for Machine Learning
- 15Containers and Kubernetes for ML
- 16Infrastructure as Code: Terraform and Ansible
- 17Cloud ML Platforms: AWS, Azure, GCP, and Self-Built
- 18Model Serving Patterns: Batch, Online, and Streaming
- 19Inference Engineering Basics: Latency, Batching, and Cost
- 20Monitoring and Observability for ML Models
- 21Drift Detection and Retraining for ML Models
- 22Explainable AI: LIME, SHAP, and Model Interpretability
- 23Edge AI Deployment: Jetson, TFLite, and Mobile ML
- 24Capstone: An End-to-End MLOps Pipeline
In traditional software engineering, an application is either healthy or broken. If a database goes offline or an unhandled null pointer exception triggers, your service returns HTTP 500 errors, error rate alerts fire within seconds, and on-call engineers triage the crash.
Machine learning systems fail differently. A production model almost never crashes with a clean stack trace when its performance degrades. Instead, it continues serving HTTP 200 OK responses with sub-20-millisecond latency while outputting mathematically meaningless predictions.
When StayWell deployed their customer churn model to production, the service operated flawlessly for three months according to standard infrastructure monitoring. CPU utilization remained steady at 35%, memory usage was stable, and the API gateway recorded zero HTTP 5xx errors. Yet behind the scenes, an upstream mobile application update renamed the user subscription field from contract_type to plan_type. The model serving container defaulted the missing feature to a fallback value. Consequently, the model predicted that virtually zero customers were at risk of leaving. Because retention teams stopped receiving churn alerts, high-value members lapsed without outreach, costing the business $180,000 in lost annual recurring revenue before anyone noticed.
The lesson on observability and tracing covers spans and token traces in multi-step AI agents, and monitoring and maintaining an app covers application health baselines. This lesson covers observability for machine learning models. You will separate system, data and model metrics, write Prometheus alerting rules, lay out a Grafana dashboard, log inference events with privacy protections, and handle labels that arrive late.
The StayWell figures in this lesson (rates, scores, counts and prices) are made up for illustration. They show how to read the numbers, not what real systems achieve.
The three pillars of MLOps observability
Traditional DevOps monitoring tracks the health of the machine. MLOps observability must track the machine, the data feeding it, and the statistical validity of its decisions.
| 1. System health (DevOps) | 2. Data integrity (inputs) | 3. Model quality (outputs) | |
|---|---|---|---|
| Watches | CPU and GPU use, memory saturation, HTTP 200 and 5xx rates, P50, P95 and P99 latency | Null rates, schema contract violations, out-of-bounds values, unseen categories | Output score drift (PSI), share of high-risk predictions, realized AUC or F1, calibration (Brier score) |
| Typical detection time | Seconds | Minutes to hours | Days to weeks, because labels arrive late |
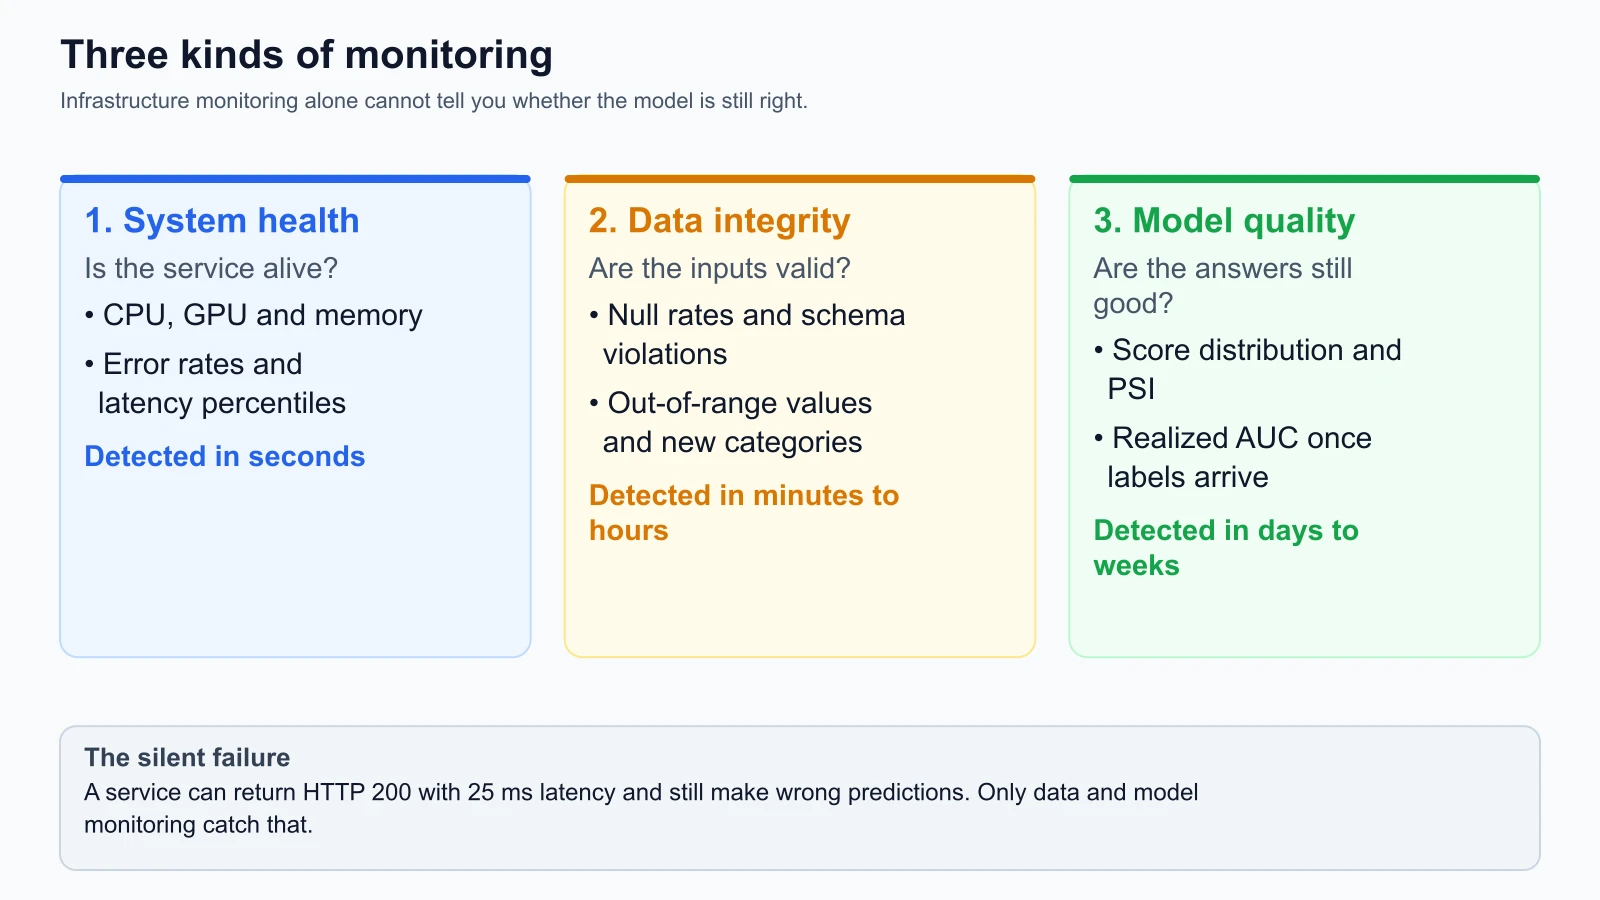
Pillar 1: System and infrastructure metrics
System metrics confirm that your container runtime and underlying hardware are functioning properly. These are standard time-series metrics collected via infrastructure agents such as Prometheus Node Exporter and Kubernetes cAdvisor:
- Compute and memory utilization: CPU load, GPU kernel utilization, GPU memory allocation, and host RAM saturation. Memory leaks in Python C-extensions eventually trigger Kubernetes Out-Of-Memory (OOM) pod terminations.
- Network and throughput: Incoming queries per second (QPS), network ingress/egress bytes, and open socket connection pools.
- Latency histograms: P50, P95, and P99 latency percentiles measured at both the API gateway and model container layers.
- HTTP status distributions: Ratios of HTTP 200 (Success), 422 (Schema Validation Failure), and 5xx (Internal Server Error) responses.
Pillar 2: Data integrity and input feature metrics
Data integrity metrics monitor the statistical and syntactic properties of incoming inference payloads before they reach the model tensor operations. Upstream schema changes, broken ETL pipelines, and third-party API mutations surface here first:
- Feature missingness: Percentage of requests where required or optional features are missing or null.
- Schema contract violations: Frequency of incoming payloads containing unrecognized data types (e.g. passing a string into an integer field) or unknown categorical values.
- Domain boundary violations: Numerical inputs falling outside plausible physical limits (e.g. negative monthly charges or a customer tenure of 300 years).
- Feature distribution drift: Statistical divergence between incoming production feature distributions and the baseline distributions recorded during model training.
Pillar 3: Model quality and prediction drift metrics
Model quality metrics evaluate what the model is outputting and whether those outputs correspond to real-world business accuracy:
- Prediction distribution shifts: Tracking the mean, variance, and quantile distributions of raw output probabilities. If a churn model historically predicts a mean churn probability of 0.18, a sudden shift to 0.04 signals severe input corruption or model degradation.
- Classification decision ratios: The percentage of live entities assigned to each actionable tier (e.g. Low Risk, Medium Risk, High Risk).
- Delayed ground truth performance: When actual customer outcomes eventually arrive (e.g. whether the customer actually cancelled their subscription 30 days later), computing realized evaluation metrics including Area Under the ROC Curve (AUC), Precision, Recall, and Brier calibration score.
Instrumenting services with Prometheus and Grafana
Prometheus is the cloud-native standard for metric collection, using a pull-based HTTP scraping model. Grafana provides the unified visualization layer (all configuration syntax checked from official documentation on 5 November 2026: Prometheus Documentation and Grafana Documentation).
Prometheus metric primitives for MLOps
Prometheus exposes four core metric types. Production model serving systems utilize three of them extensively:
-
Counter: A cumulative metric that only ever increases or resets to zero upon restart. Used to track total inference requests, prediction labels, and validation failures:
text1# HELP ml_predictions_total Total count of model predictions served 2# TYPE ml_predictions_total counter 3ml_predictions_total{model="churn",version="v1.4.2",risk_tier="HIGH"} 14820 4ml_predictions_total{model="churn",version="v1.4.2",risk_tier="LOW"} 68910 -
Gauge: An instantaneous value that can arbitrarily increase or decrease. Ideal for memory footprints, batch queue lengths, and rolling statistical metrics:
text1# HELP ml_feature_missingness_ratio Current ratio of missing feature values 2# TYPE ml_feature_missingness_ratio gauge 3ml_feature_missingness_ratio{model="churn",feature="support_tickets"} 0.0012 4 5# HELP ml_realized_auc_30d Realized AUC evaluated on 30-day ground truth cohort 6# TYPE ml_realized_auc_30d gauge 7ml_realized_auc_30d{model="churn",version="v1.4.2"} 0.842 -
Histogram: Samples observations into configurable cumulative buckets, enabling accurate calculation of quantiles (P50, P95, P99) and averages:
text1# HELP ml_inference_duration_seconds Latency of model forward pass in seconds 2# TYPE ml_inference_duration_seconds histogram 3ml_inference_duration_seconds_bucket{le="0.01"} 4210 4ml_inference_duration_seconds_bucket{le="0.025"} 8940 5ml_inference_duration_seconds_bucket{le="0.05"} 12890 6ml_inference_duration_seconds_bucket{le="+Inf"} 13010 7ml_inference_duration_seconds_count 13010 8ml_inference_duration_seconds_sum 268.42
Production PromQL alerting rules
Alert rules must be specific, actionable, and tied directly to service level objectives. A rule that fires without requiring clear remediation creates alert fatigue, training engineers to ignore pages.
Here are production Prometheus alerting rules for StayWell's model serving deployment (from the docs, not run):
1# prometheus_alerts.yml (from the docs, not run)
2groups:
3  - name: mlops_serving_alerts
4    rules:
5      - alert: HighInferenceErrorRate
6        expr: |
7          sum(rate(http_requests_total{status=~"5.."}[5m]))
8          /
9          sum(rate(http_requests_total[5m])) > 0.01
10        for: 2m
11        labels:
12          severity: critical
13        annotations:
14          summary: "Inference endpoint 5xx error rate exceeds 1%"
15          description: "Model service {{ $labels.instance }} is failing 1% of live requests over a 5m window."
16
17      - alert: HighLatencyTailBreach
18        expr: |
19          histogram_quantile(0.99, sum(rate(ml_inference_duration_seconds_bucket[5m])) by (le)) > 0.060
20        for: 5m
21        labels:
22          severity: warning
23        annotations:
24          summary: "Inference P99 latency exceeds 60ms SLA"
25          description: "P99 latency has reached {{ $value }}s on version {{ $labels.version }}."
26
27      - alert: InputFeatureSchemaViolationSpike
28        expr: |
29          sum(rate(ml_schema_violations_total[5m])) > 5
30        for: 3m
31        labels:
32          severity: critical
33        annotations:
34          summary: "High volume of rejected input payloads"
35          description: "Over 5 payloads per second are failing defensive schema validation. Check upstream callers."
36
37      - alert: ModelPredictionDriftWarning
38        expr: |
39          abs(
40            avg_over_time(ml_predicted_churn_probability[1h]) - 0.184
41          ) / 0.184 > 0.25
42        for: 30m
43        labels:
44          severity: warning
45        annotations:
46          summary: "Model prediction distribution shifted by more than 25%"
47          description: "Hourly average predicted churn rate deviated to {{ $value }}. Check for input drift."
Designing the MLOps dashboard layout
A well-structured Grafana dashboard groups panels hierarchically so on-call engineers can triage incidents within seconds, while data scientists can investigate subtle statistical trends over days.
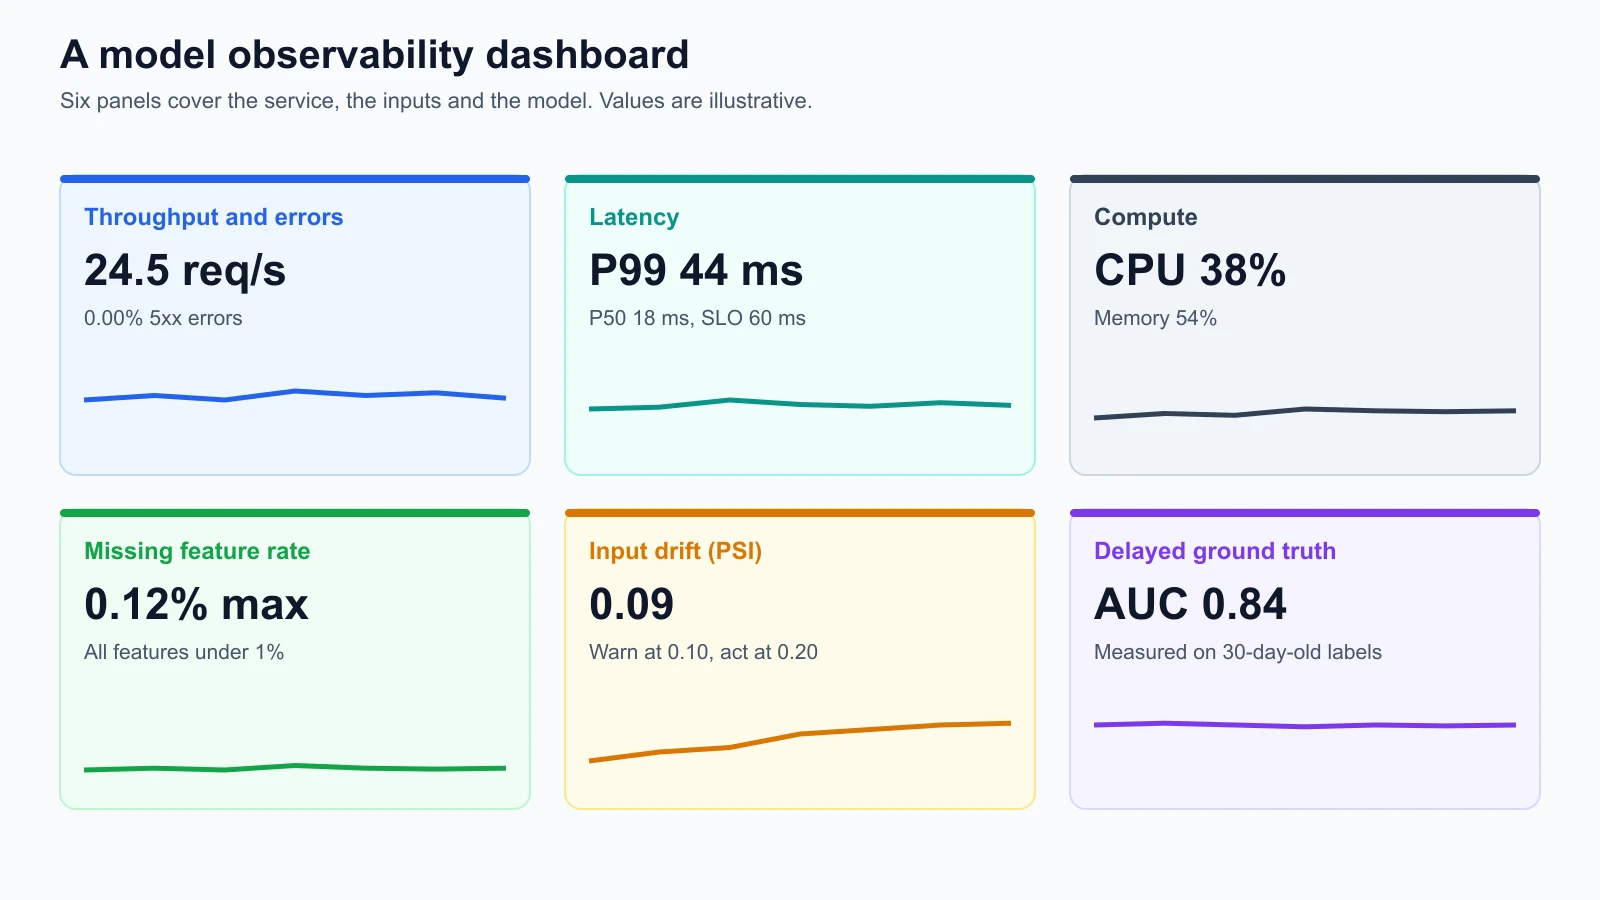
A production MLOps dashboard consists of three organized rows:
- Top Row: System and service health (On-call view)
- Panel 1: Throughput QPS and HTTP 5xx error rates (stacked time series).
- Panel 2: Latency budget: P50 (green) versus P99 (amber) with an explicit red dashed SLA threshold at 60ms.
- Panel 3: Hardware resources: Gauges displaying container CPU utilization (%) and host memory saturation (%).
- Middle Row: Data pipeline and feature integrity (Data engineering view)
- Panel 4: Feature missingness rate (%) across the top five most important model features.
- Panel 5: Schema and contract rejection count (big numerical stat, green if 0, red if ).
- Panel 6: Feature drift summary: Population Stability Index (PSI) values for incoming features compared to the training baseline (green , amber to , red ).
- Bottom Row: Model quality and business outcomes (Data science view)
- Panel 7: Real-time prediction distribution histogram (verifying probability shape).
- Panel 8: Daily high-risk churn rate (%) tracking whether the model identifies an expected 16% to 21% churn cohort.
- Panel 9: Delayed ground truth: 30-day realized AUC rolling line chart evaluated against historical retention outcomes.
Logging inference requests safely with privacy care
Observability requires logging inference inputs and outputs so anomalies can be audited and debugged. However, storing raw inference payloads indiscriminately introduces severe regulatory, legal, and security liabilities.
Under GDPR, HIPAA, and CCPA, logging unmasked customer email addresses, phone numbers, or credit card numbers inside operational logs violates data privacy mandates. In addition, if inference logs are retained indefinitely on unencrypted disks, they become prime targets for security breaches.
Follow these four mandatory privacy guardrails when implementing inference logging:
A raw request such as {"customer_id": "C-9821", "email": "sara@example.com", "tenure_months": 14} goes through a logging sanitizer before anything is stored:
- Drop direct identifiers: remove the email, address and phone number entirely.
- Hash the identifier: replace
customer_idwith a salted, irreversible hash such assha256(customer_id + secret_salt). - Round sensitive numbers: store
monthly_chargesrounded to one decimal place.
The sanitized audit record (for example {"request_id": "req-8f1a", "hashed_id": "e3b0c442...", "tenure": 14}) goes into encrypted object storage with a retention rule that deletes it automatically after 90 days.
- Strip direct identifiers: Never log names, email addresses, social security numbers, or raw IP addresses. If an identifier is strictly necessary to join with delayed ground truth, use a cryptographically salted one-way hash (e.g.
sha256(customer_id + pepper)). - Coarsen numerical features: Coarsen sensitive demographic or financial values into broad bins (e.g. recording income bracket
[50k-75k]rather than exact net salary). - Separate operational metrics from payload logs: High-frequency operational telemetry (QPS, error counts, latency) should be captured as anonymous Prometheus time-series counters without any payload strings.
- Enforce automatic retention lifecycles: Store sanitized payload logs in object storage (such as Amazon S3 or Google Cloud Storage) configured with automated lifecycle rules that permanently delete audit records after 90 days.
The delayed ground truth dilemma
The fundamental difference between monitoring a web server and monitoring a machine learning model is ground truth latency.
When you monitor an e-commerce checkout service, you know immediately whether a payment transaction succeeded or failed: the payment gateway returns an HTTP status code within 500 milliseconds. When StayWell predicts that a customer has an 82% probability of churning, that prediction cannot be verified immediately. The customer might cancel their subscription next week, in two months, or continue paying for years. In loan default prediction, ground truth takes months or years. In medical diagnosis models, ground truth requires lab biopsy confirmations.
| When | What is known | What you can monitor |
|---|---|---|
| Day 0 | The model predicts churn with probability 0.82; realized accuracy is unknown | Proxy metrics: input drift and prediction drift |
| Days 1 to 30 | The customer uses the service and may receive retention outreach | The same proxy metrics |
| Day 30 | Ground truth arrives: the customer cancelled or stayed | An evaluation job joins the Day 0 prediction with the Day 30 billing record and computes realized AUC, precision, recall and Brier score |
Because realized performance cannot be measured in real time, mature MLOps teams operate a two-tier evaluation strategy:
- Real-time proxy monitoring (Leading indicators): Continuously evaluate input feature drift and output prediction distribution drift. If the inputs have not changed and the distribution of output scores matches the training baseline, the model is mathematically stable.
- Asynchronous ground truth reconciliation (Lagging indicators): An automated scheduled pipeline (e.g. an Airflow DAG running monthly) extracts real-world outcomes from billing databases, joins them with sanitized inference logs using the hashed customer identifier, and calculates realized statistical metrics (AUC, F1, calibration curves). If the realized 30-day AUC falls below 0.80, the system triggers an automated retraining workflow.
Production MLOps monitoring plan template
Every production machine learning model must be accompanied by an approved Monitoring Plan documented in Markdown and maintained inside the project repository:
1# MLOps Monitoring Plan: [Model Name]
2
3* **Model Identifier:** `staywell-churn-predictor`
4* **Current Production Version:** `v1.4.2`
5* **Primary On-Call Team:** MLOps Platform Team (`#mlops-oncall`)
6* **Model Owner:** Customer Analytics Data Science Team
7
8## 1. System Health SLIs and SLOs
9| Metric | Measurement Window | Target SLO | Alert Severity |
10| :--- | :--- | :--- | :--- |
11| Availability | 5 minutes | 99.9% (5xx < 0.1%) | Critical (Page) |
12| Latency P50 | 5 minutes | < 25 milliseconds | Warning (Slack) |
13| Latency P99 | 5 minutes | < 60 milliseconds | Critical (Page) |
14| Container RAM | Instantaneous | < 75% allocated | Warning (Slack) |
15
16## 2. Input Data Integrity Guardrails
17| Feature Name | Expected Type | Domain Range | Max Null Rate |
18| :--- | :--- | :--- | :--- |
19| `tenure_months` | Integer | [0, 120] | 0.00% |
20| `monthly_charges`| Float | [0.0, 500.0] | 0.00% |
21| `support_tickets`| Integer | [0, 50] | 0.50% |
22| `contract_type` | Enum | {"month-to-month", "one-year", "two-year"} | 0.00% |
23
24## 3. Statistical Drift Thresholds
25* **Feature Drift:** Evaluated daily using Population Stability Index (PSI).
26  - PSI < 0.10: Stable (No action).
27  - 0.10 <= PSI < 0.20: Moderate shift (Log warning).
28  - PSI >= 0.20: Significant drift (Alert data engineering for investigation).
29* **Output Score Drift:** Hourly mean prediction must remain within [0.14, 0.22].
30
31## 4. Ground Truth Reconciliation Strategy
32* **Outcome Latency Window:** 30 days after prediction timestamp.
33* **Evaluation Cadence:** Monthly automated Airflow DAG joining S3 logs with Aurora billing tables.
34* **Retraining Trigger:** Realized AUC drops below 0.80 or Brier score exceeds 0.15.
35
36## 5. Privacy and Retention Policy
37* Direct PII (email, name) stripped before logging.
38* Customer identifier hashed using salted SHA-256.
39* Prediction logs retained in encrypted S3 bucket for exactly 90 days.
Practical code: Lightweight metrics collector and alert evaluator
Below is a self-contained, fully tested Python implementation of a Prometheus-style metric collector (Counters, Gauges, Histograms) and an automated alert rule evaluator. It enables teams to instrument model inference logic, record operational metrics with multi-dimensional labels, and verify alert conditions using pure Python standard libraries.
metrics_engine.py
1"""
2MLOps Metric Collection and Alert Rule Evaluator.
3
4Provides:
5- Multi-dimensional Counters, Gauges, and Histograms
6- Label-based metric indexing
7- Threshold evaluation for operational and statistical alert rules
8- Complete compatibility with Python standard library
9"""
10
11from dataclasses import dataclass
12from typing import Dict, List, Any, Optional, Tuple
13
14
15class Counter:
16    """Monotonically increasing counter with multi-dimensional label support."""
17
18    def __init__(self, name: str, description: str):
19        self.name = name
20        self.description = description
21        self.values: Dict[Tuple[Tuple[str, str], ...], float] = {}
22
23    def _labels_key(self, labels: Optional[Dict[str, str]]) -> Tuple[Tuple[str, str], ...]:
24        if not labels:
25            return ()
26        return tuple(sorted(labels.items()))
27
28    def inc(self, value: float = 1.0, labels: Optional[Dict[str, str]] = None):
29        """Increment counter by a positive value."""
30        if value < 0:
31            raise ValueError("Counters can only be incremented with non-negative values")
32        key = self._labels_key(labels)
33        self.values[key] = self.values.get(key, 0.0) + value
34
35    def get(self, labels: Optional[Dict[str, str]] = None) -> float:
36        """Retrieve current value for given label combination."""
37        key = self._labels_key(labels)
38        return self.values.get(key, 0.0)
39
40
41class Gauge:
42    """Instantaneous numerical value that can arbitrarily increase or decrease."""
43
44    def __init__(self, name: str, description: str):
45        self.name = name
46        self.description = description
47        self.values: Dict[Tuple[Tuple[str, str], ...], float] = {}
48
49    def _labels_key(self, labels: Optional[Dict[str, str]]) -> Tuple[Tuple[str, str], ...]:
50        if not labels:
51            return ()
52        return tuple(sorted(labels.items()))
53
54    def set(self, value: float, labels: Optional[Dict[str, str]] = None):
55        """Set gauge to an explicit numeric value."""
56        key = self._labels_key(labels)
57        self.values[key] = float(value)
58
59    def get(self, labels: Optional[Dict[str, str]] = None) -> float:
60        """Retrieve current value for given label combination."""
61        key = self._labels_key(labels)
62        return self.values.get(key, 0.0)
63
64
65class Histogram:
66    """Tracks numerical value distributions across predefined bucket thresholds."""
67
68    def __init__(self, name: str, description: str, buckets: List[float]):
69        self.name = name
70        self.description = description
71        self.buckets = sorted(buckets)
72        self.bucket_counts: Dict[float, int] = {b: 0 for b in self.buckets}
73        self.bucket_counts[float("inf")] = 0
74        self.count = 0
75        self.sum = 0.0
76
77    def observe(self, value: float):
78        """Record an observed floating-point sample."""
79        self.count += 1
80        self.sum += value
81        for b in self.buckets:
82            if value <= b:
83                self.bucket_counts[b] += 1
84        self.bucket_counts[float("inf")] += 1
85
86    def get_cumulative_counts(self) -> Dict[float, int]:
87        """Return cumulative counts for each threshold bucket."""
88        return dict(self.bucket_counts)
89
90
91@dataclass(frozen=True)
92class AlertRule:
93    """Defines an evaluation condition against an active metric."""
94    name: str
95    metric_name: str
96    threshold: float
97    comparator: str  # ">", "<", ">=", "<="
98    severity: str    # "warning", "critical"
99    summary: str
100
101
102class AlertEvaluator:
103    """Evaluates Prometheus-style alert rules against active metrics."""
104
105    def __init__(self):
106        self.rules: List[AlertRule] = []
107
108    def add_rule(self, rule: AlertRule):
109        """Register a new alerting rule."""
110        self.rules.append(rule)
111
112    def evaluate(self, current_metrics: Dict[str, float]) -> List[Dict[str, Any]]:
113        """Evaluate all registered rules against a dictionary of active metric values."""
114        firing_alerts: List[Dict[str, Any]] = []
115
116        for r in self.rules:
117            if r.metric_name not in current_metrics:
118                continue
119
120            val = current_metrics[r.metric_name]
121            triggered = False
122
123            if r.comparator == ">" and val > r.threshold:
124                triggered = True
125            elif r.comparator == ">=" and val >= r.threshold:
126                triggered = True
127            elif r.comparator == "<" and val < r.threshold:
128                triggered = True
129            elif r.comparator == "<=" and val <= r.threshold:
130                triggered = True
131
132            if triggered:
133                firing_alerts.append({
134                    "alert_name": r.name,
135                    "severity": r.severity,
136                    "metric": r.metric_name,
137                    "value": val,
138                    "threshold": r.threshold,
139                    "summary": r.summary
140                })
141
142        return firing_alerts
Unit test suite verifying metric collectors and alert triggers
Here is the unit test suite verifying counters, gauges, histograms, and alert rule evaluations:
metrics_engine_test.py
1import unittest
2from metrics_engine import AlertEvaluator, AlertRule, Counter, Gauge, Histogram
3
4
5class TestObservabilityEngine(unittest.TestCase):
6    def test_counter_increments_and_labels(self):
7        c = Counter("ml_requests_total", "Total inference requests")
8        c.inc(1.0, {"status": "200", "model": "churn_v1"})
9        c.inc(2.0, {"status": "200", "model": "churn_v1"})
10        c.inc(1.0, {"status": "500", "model": "churn_v1"})
11
12        self.assertEqual(c.get({"status": "200", "model": "churn_v1"}), 3.0)
13        self.assertEqual(c.get({"status": "500", "model": "churn_v1"}), 1.0)
14        self.assertEqual(c.get({"status": "404", "model": "churn_v1"}), 0.0)
15
16        with self.assertRaises(ValueError):
17            c.inc(-1.0)
18
19    def test_gauge_updates(self):
20        g = Gauge("model_realized_auc", "Realized AUC over 30d cohort")
21        g.set(0.852, {"model": "churn_v1"})
22        self.assertAlmostEqual(g.get({"model": "churn_v1"}), 0.852)
23        g.set(0.791, {"model": "churn_v1"})
24        self.assertAlmostEqual(g.get({"model": "churn_v1"}), 0.791)
25
26    def test_histogram_buckets(self):
27        h = Histogram(
28            name="inference_latency_seconds",
29            description="Latency in seconds",
30            buckets=[0.01, 0.025, 0.05, 0.1]
31        )
32        h.observe(0.008)  # <= 0.01
33        h.observe(0.020)  # <= 0.025
34        h.observe(0.045)  # <= 0.05
35        h.observe(0.120)  # > 0.10
36
37        self.assertEqual(h.count, 4)
38        self.assertAlmostEqual(h.sum, 0.193)
39        cum = h.get_cumulative_counts()
40        self.assertEqual(cum[0.01], 1)
41        self.assertEqual(cum[0.025], 2)
42        self.assertEqual(cum[0.05], 3)
43        self.assertEqual(cum[0.1], 3)
44        self.assertEqual(cum[float("inf")], 4)
45
46    def test_alert_evaluator(self):
47        evaluator = AlertEvaluator()
48        evaluator.add_rule(AlertRule(
49            name="HighInferenceErrorRate",
50            metric_name="http_5xx_rate",
51            threshold=0.01,
52            comparator=">",
53            severity="critical",
54            summary="HTTP 5xx rate exceeded 1%"
55        ))
56        evaluator.add_rule(AlertRule(
57            name="ModelAUCBelowThreshold",
58            metric_name="realized_auc",
59            threshold=0.80,
60            comparator="<",
61            severity="warning",
62            summary="Realized AUC dropped below 0.80 baseline"
63        ))
64
65        # Test normal metrics: no alerts firing
66        normal = {"http_5xx_rate": 0.002, "realized_auc": 0.845}
67        alerts = evaluator.evaluate(normal)
68        self.assertEqual(len(alerts), 0)
69
70        # Test degraded metrics: both alerts fire
71        degraded = {"http_5xx_rate": 0.035, "realized_auc": 0.782}
72        firing = evaluator.evaluate(degraded)
73        self.assertEqual(len(firing), 2)
74        alert_names = {a["alert_name"] for a in firing}
75        self.assertIn("HighInferenceErrorRate", alert_names)
76        self.assertIn("ModelAUCBelowThreshold", alert_names)
77
78
79if __name__ == "__main__":
80    unittest.main()
Save both files in the same folder and run the tests from that folder:
1python3 -m unittest discover -p '*_test.py'Mistakes beginners make
1. Relying solely on HTTP 200 and latency metrics
Teams frequently assume that because Prometheus reports 100% HTTP 200 responses and 25ms P99 latency, the machine learning system is healthy. Silent failures (such as corrupted input features, missing columns replaced by default values, or catastrophic model drift) almost never produce HTTP 5xx errors.
Fix: Instrument metrics across all three pillars. Monitor feature missingness ratios, schema contract rejection counts, and output prediction score distributions alongside traditional infrastructure health checks.
2. Paging on-call engineers for statistical drift
Engineering teams sometimes configure high-urgency PagerDuty alarms that wake engineers at 3:00 AM whenever a feature's daily Kolmogorov-Smirnov or PSI test crosses an arbitrary threshold. Because statistical drift cannot be resolved by restarting a Kubernetes pod or bouncing a server, engineers become fatigued and begin ignoring all alerts.
Fix: Reserve critical pages exclusively for actionable system outages (high 5xx error rates, database disconnections, or complete traffic drop-offs). Route data integrity and statistical drift warnings to team ticketing queues or daytime Slack channels for scheduled engineering review.
3. Dumping raw PII into unencrypted log aggregators
Developers often insert debug statements like logger.info(f"Scoring request: {payload}") to troubleshoot serving issues. This writes plain-text credit card numbers, passwords, names, and health records into central logging platforms like Elasticsearch or CloudWatch, violating compliance regulations and creating massive data leak risks.
Fix: Implement automated sanitizers at the logging boundary. Strip direct PII, hash user identifiers using cryptographically salted SHA-256 digests, and configure automated 90-day data retention lifecycles on all log storage buckets.
4. Ignoring delayed ground truth reconciliation
Teams often deploy models and evaluate their performance only once during initial training, assuming the model will maintain that accuracy indefinitely. Without a scheduled pipeline to join historical predictions with realized business outcomes, model degradation goes undetected until quarterly financial reports reveal lost revenue.
Fix: Build an automated asynchronous reconciliation pipeline that periodically joins historical inference logs with delayed production ground truth. Calculate rolling validation metrics (such as 30-day realized AUC) and configure automated retrain alerts when accuracy drops below baseline.
Recap and try it yourself
In this lesson, we established the operational architecture required to monitor production machine learning systems:
- The three pillars of MLOps observability: Monitor system health (DevOps), data integrity (inputs), and model quality (outputs) to prevent silent statistical failure modes.
- Prometheus metric primitives: Use Counters for request volumes, Gauges for memory and realized accuracy, and Histograms for latency distributions.
- Actionable alerting: Differentiate between urgent system outages that warrant on-call pages and statistical drift warnings that should be triaged during business hours.
- Privacy-conscious logging: Scrub direct PII, salt-hash customer identifiers, and enforce automated 90-day log deletion lifecycles.
- Delayed ground truth: Bridge the outcome delay gap using real-time proxy monitoring (PSI, output distributions) paired with asynchronous monthly ground truth joins.
Hands-on exercises
- Simulate a feature corruption incident:
Using the
CounterandAlertEvaluatorclasses from our practical code, write a script that simulates 1,000 inference requests. Simulate an incident where an upstream client sends 50 requests with an invalidcontract_type. Verify thatml_schema_violations_totalincrements and triggers anInputFeatureSchemaViolationSpikecritical alert. - Design a Grafana alert query:
Write a PromQL expression that triggers a warning if the 95th percentile inference duration for
churn_predictor:v1.4.2exceeds 40 milliseconds over a 10-minute evaluation window. - Implement a PII sanitizer:
Write a Python function
sanitize_payload(raw_dict: dict, salt: str) -> dictthat removes keys namedemailandphone, and replacescustomer_idwith its hex-encoded SHA-256 salted hash. Verify with a test payload.