
MLOps course · lesson 10 of 24
- 1What Is MLOps? From Notebooks to Reliable Production
- 2MLOps Principles and Maturity: From Manual to Automated
- 3ML Fundamentals for MLOps: Splits, Leakage, and Metrics
- 4A Reproducible ML Project: Layout, Seeds, and Data Code
- 5Data Engineering Basics for ML: Ingestion, SQL, and Skew
- 6Pipeline Orchestration: Apache Airflow and Kubeflow
- 7Batch vs Streaming: Spark, Kafka, and Flink
- 8Data Versioning and Lineage: DVC and Beyond
- 9Data Validation and Quality in ML Pipelines
- 10Experiment Tracking with MLflow
- 11Reproducible Training Pipelines
- 12Model Evaluation and Validation Gates
- 13Model Registry and Versioning
- 14CI/CD for Machine Learning
- 15Containers and Kubernetes for ML
- 16Infrastructure as Code: Terraform and Ansible
- 17Cloud ML Platforms: AWS, Azure, GCP, and Self-Built
- 18Model Serving Patterns: Batch, Online, and Streaming
- 19Inference Engineering Basics: Latency, Batching, and Cost
- 20Monitoring and Observability for ML Models
- 21Drift Detection and Retraining for ML Models
- 22Explainable AI: LIME, SHAP, and Model Interpretability
- 23Edge AI Deployment: Jetson, TFLite, and Mobile ML
- 24Capstone: An End-to-End MLOps Pipeline
Every machine learning project begins with exploration. A data scientist opens a notebook, tests five feature combinations, adjusts learning rates, swaps a Random Forest for a Gradient Boosting classifier, and prints validation metrics to the console.
Three weeks later, the team asks a straightforward question: which exact set of hyperparameters produced the 0.864 ROC AUC score achieved on October 14th? The developer searches through notebook cell outputs, terminal history, and personal notes. The exact commit is lost, the dataset has since received new rows, and the winning model cannot be reproduced.
Relying on console printouts, scratch notes, or manually maintained spreadsheets is one of the quickest ways to accumulate technical debt in machine learning. Training an ML model is an experimental science. If you cannot query the inputs, outputs, code state, and environment of an experiment, that experiment did not happen.
In this lesson, you will learn the mechanics of experiment tracking. You will examine what a run record must hold, study the architecture of MLflow Tracking, learn how to compare runs across multiple evaluation dimensions, and build a fully tested, lightweight Python experiment tracker from scratch.
The four pillars of a run record
An experiment tracking system acts as a specialized, queryable database designed for the machine learning lifecycle. Every execution of a training script generates an isolated Run Record.
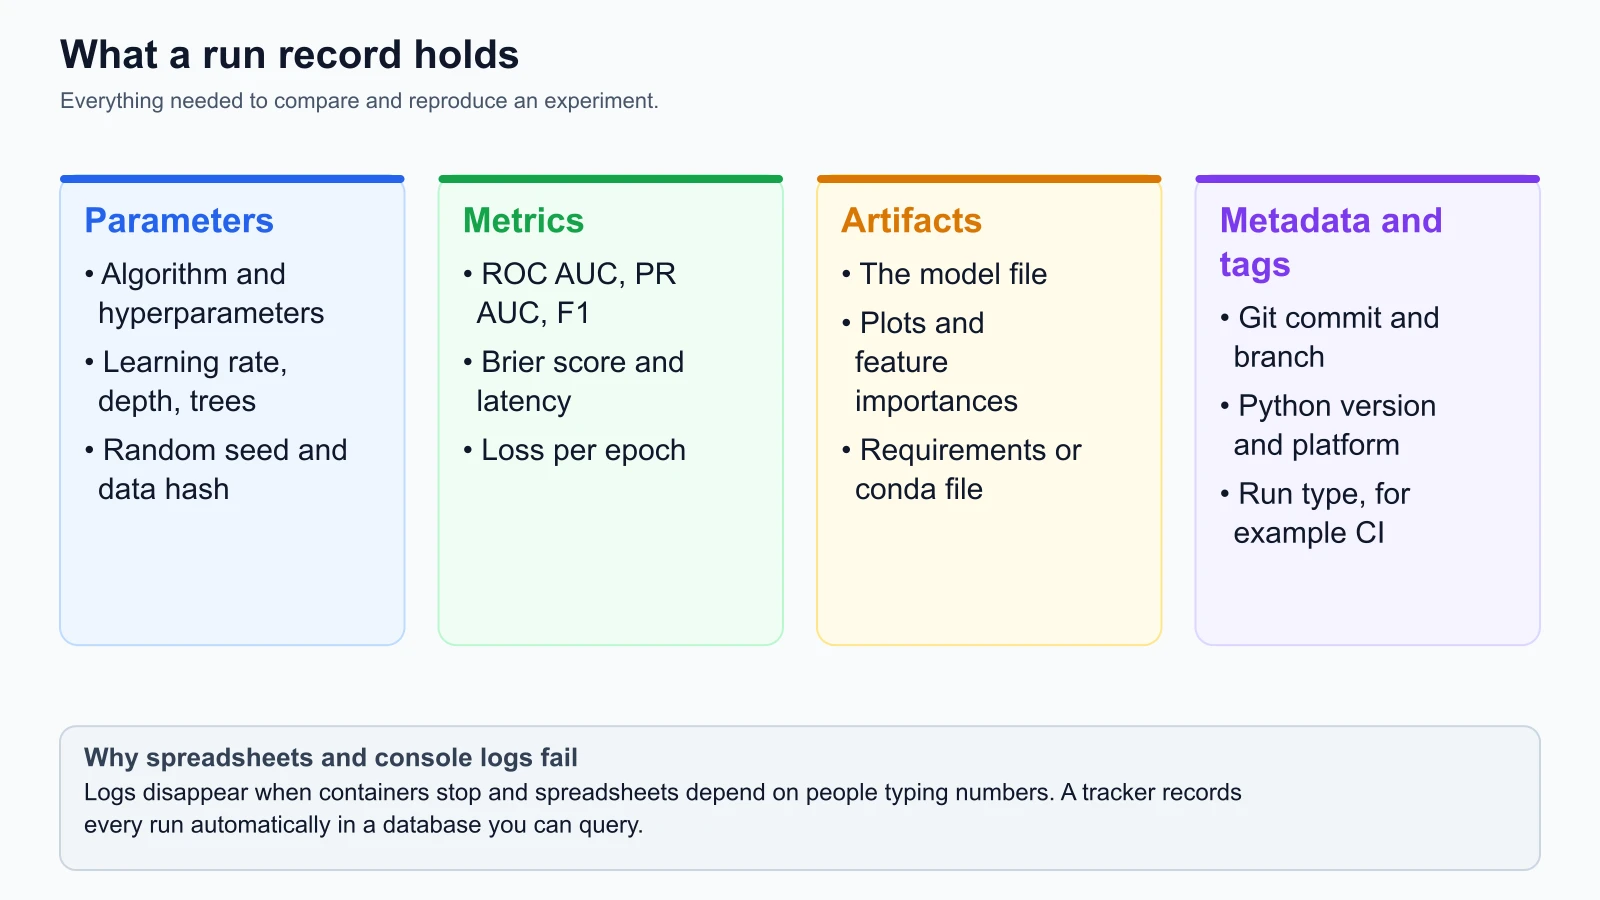
A useful run record captures four categories of information:
1. Parameters (Run inputs)
Parameters represent the immutable configuration values that define how the experiment ran:
- Hyperparameters: Learning rate, tree depth, number of estimators, batch size, regularization penalties, and dropout rates.
- Data references: The cryptographic content hash or DVC pointer of the training dataset (for example,
7b9c1d0f), train/test split ratios, and random seeds. - Architectural choices: Model type, loss function name, feature column lists, and categorical encoder settings.
Parameters are recorded at the start of a run and remain constant throughout execution.
2. Metrics (Run outputs over time)
Metrics measure the statistical and operational performance of the model:
- Scalar summary metrics: Single floating-point values computed after evaluation completes (such as test ROC AUC, Brier calibration score, Precision at 10% recall, and F1 score).
- Time-series curves: Sequences of scalar values recorded across training steps or epochs (such as training loss, validation loss, and learning rate schedules).
- Operational metrics: Model size in megabytes, p95 inference latency in milliseconds, and peak RAM consumption during scoring.
Unlike parameters, metrics can be logged iteratively as training progresses, allowing teams to monitor convergence and detect overfitting in real time.
3. Artifacts (Binary outputs)
Artifacts are heavy binary and text files produced during training that cannot fit into standard database rows:
- Serialized model weights: The trained pipeline or weight checkpoint (for example,
model.joblib,model.onnx, or PyTorch state dictionaries). - Diagnostic visualizations: Confusion matrix plots, ROC and precision-recall curves, calibration plots, and SHAP feature importance charts.
- Environment manifests: Pinned
requirements.txt,conda.yaml, or Docker container digest to guarantee runtime reproducibility.
Artifacts are stored in durable object storage (such as Amazon S3, Google Cloud Storage, or Azure Blob Storage) with their file URIs linked directly to the run record.
4. Metadata and tags (Context and provenance)
Tags provide search keys, execution context, and provenance:
- Git provenance: Git commit SHA (such as
a94f8e12), active branch, and repository URL. - Execution context: Operating system, Python interpreter version, host machine hostname, and user ID.
- Organizational tags: Project name, experiment phase (for example,
exploration,hyperparameter-sweep, orcandidate-release), and business goal.
MLflow Tracking: architecture and workflows
The open-source standard for experiment tracking is MLflow, hosted under the Linux Foundation.
The official MLflow Documentation (verified on 4 November 2026) describes MLflow as an open-source platform for managing the end-to-end machine learning lifecycle. Its core tracking module provides an API and UI for logging parameters, code versions, metrics, and output files.
Centralized server versus local file store
MLflow operates in two deployment modes:
- Local file store (Solo development): When developing locally, MLflow writes metadata and metrics to a local directory named
./mlruns. The MLflow UI launches locally viamlflow ui, reading directly from disk without requiring any external database. - Centralized tracking server (Team production): In a team environment, MLflow runs as a centralized web service. It connects to two backing stores:
- Backend Store: A relational database (such as PostgreSQL or MySQL) that stores parameters, scalar metrics, tags, run statuses, and experiment hierarchies.
- Artifact Store: A shared cloud object store (such as Amazon S3 or Google Cloud Storage) that holds serialized model binaries, plots, and manifests.
When an automated CI job or data scientist kicks off a training script on AWS or Kubernetes, the Python SDK streams parameters and metrics to the tracking server over HTTP, while large model weights upload directly to S3.
Using the MLflow Python API
Here is how a complete StayWell churn experiment is recorded using the standard MLflow API:
1# StayWell churn experiment logging with MLflow
2# Checked on MLflow 3.18.0 (5 November 2026) against a local SQLite tracking store.
3# X_train, y_train, X_test and y_test come from your own train and test split.
4import mlflow
5import mlflow.sklearn
6from sklearn.ensemble import GradientBoostingClassifier
7from sklearn.metrics import roc_auc_score, brier_score_loss
8
9# Connect to the centralized team tracking server
10mlflow.set_tracking_uri("https://mlflow.internal.staywell.com")
11mlflow.set_experiment("staywell-customer-churn-v2")
12
13# Start an isolated, tracked run context
14with mlflow.start_run(run_name="gbdt-depth4-lr005") as run:
15    # 1. Log immutable run parameters
16    params = {
17        "algorithm": "GradientBoostingClassifier",
18        "n_estimators": 200,
19        "learning_rate": 0.05,
20        "max_depth": 4,
21        "subsample": 0.8,
22        "random_seed": 42,
23        "data_hash": "7b9c1d0f8a32"
24    }
25    mlflow.log_params(params)
26
27    # 2. Set operational tags for governance
28    mlflow.set_tags({
29        "git_commit": "a94f8e12d59a",
30        "author": "alex",
31        "pipeline_stage": "candidate-evaluation"
32    })
33
34    # Train model (simulated execution)
35    model = GradientBoostingClassifier(
36        n_estimators=params["n_estimators"],
37        learning_rate=params["learning_rate"],
38        max_depth=params["max_depth"],
39        random_state=params["random_seed"]
40    )
41    model.fit(X_train, y_train)
42
43    # 3. Evaluate and log metrics
44    y_pred_proba = model.predict_proba(X_test)[:, 1]
45    metrics = {
46        "roc_auc": float(roc_auc_score(y_test, y_pred_proba)),
47        "brier_score": float(brier_score_loss(y_test, y_pred_proba))
48    }
49    mlflow.log_metrics(metrics)
50
51    # 4. Log serialized model artifact and dependencies
52    mlflow.sklearn.log_model(
53        sk_model=model,
54        name="model",
55        registered_model_name="staywell-churn-classifier",
56        skops_trusted_types=["sklearn.tree._tree.Tree"],
57    )
In this snippet, MLflow captures every dimension needed to reproduce the run: parameters, tags, metrics and the model artifact. Anyone on the team can open the tracking UI, compare the ROC AUC score, download the stored model and check out the Git commit recorded in the tags.
Two details changed in MLflow 3. The model argument is now name, where older code used artifact_path. And MLflow saves scikit-learn models in the safer skops format by default, which refuses to load types it does not recognise. Tree models such as gradient boosting contain the type sklearn.tree._tree.Tree, so the snippet lists it in skops_trusted_types after review. Without that argument the call fails with an "untrusted types" error. The alternative, serialization_format="cloudpickle", works but loads with pickle, which can run arbitrary code when a file comes from someone else.
Beyond MLflow: alternative tracking ecosystems
While MLflow is the industry standard for self-hosted, vendor-neutral MLOps, other tracking ecosystems address specific team requirements:
- Weights & Biases (W&B): The Weights & Biases Documentation (verified on 4 November 2026) highlights its managed platform, rich deep-learning training dashboards, GPU hardware monitoring, and collaborative experiment reporting. W&B is widely adopted for deep learning and LLM pre-training where real-time hardware telemetry and custom interactive charts are essential.
- Comet ML: The Comet Documentation (verified on 4 November 2026) provides commercial enterprise experiment tracking with built-in code diffing, dataset versioning integrations, and automated hyperparameter optimization.
- Neptune.ai: Emphasizes high-scale metadata logging, designed to handle millions of metric points without UI performance degradation.
Regardless of the tool chosen, the underlying mechanics remain identical: decoupling run metadata from ephemeral execution environments and persisting it in an auditable store.
Comparing runs to select production candidates
Collecting run records is useful only if you can compare them systematically. When evaluating fifty experimental runs from a hyperparameter tuning sweep, data scientists frequently make the mistake of picking the run with the absolute highest test score.
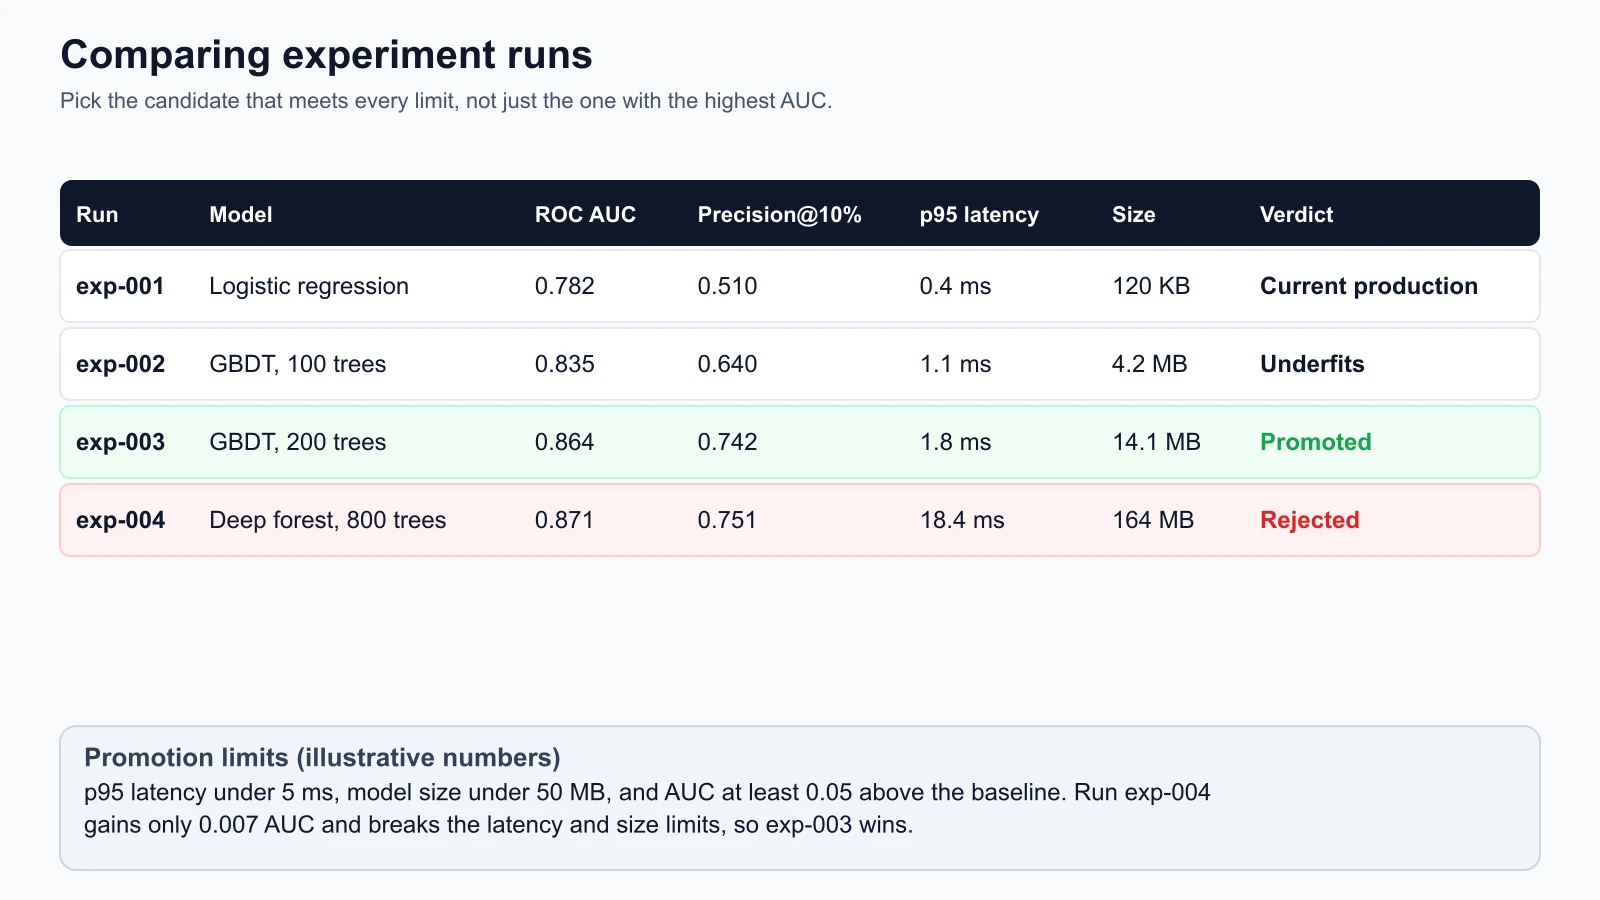
In production MLOps, selecting a candidate model requires evaluating multi-metric trade-offs:
- Statistical Quality: Does the model surpass established baseline metrics (for example, ROC AUC improvement greater than 0.05 over the simple logistic regression baseline)?
- Inference Latency SLA: Does the model score predictions fast enough to meet live API latency budgets (for example, p95 latency under 5 milliseconds)?
- Operational Footprint: Does the serialized model size fit comfortably into microservice container memory without causing disk spills or slow cold starts?
In the StayWell comparison shown above:
- Run exp-001 (Baseline): Super fast (0.4 ms), but weak predictive power (0.782 AUC).
- Run exp-004 (Deep Forest): Achieved the highest raw AUC (0.871), but increased inference latency by ten times (18.4 ms) and ballooned memory footprint to 164 MB, violating the 5 ms API SLA.
- Run exp-003 (Tuned GBDT): Delivered strong predictive power (0.864 AUC) while easily satisfying the latency budget (1.8 ms) and maintaining a lightweight footprint (14.1 MB).
Run exp-003 is the objective winner. Experiment tracking makes this trade-off visible and verifiable.
Operational template: experiment tracking protocol
To prevent clutter and inconsistent naming across team members, every machine learning team should document an experiment tracking protocol.
1# StayWell MLOps Experiment Tracking Protocol
2# Document ID: SOP-TRACKING-V1
3# Scope: All models trained for customer churn and revenue forecasting
4
5## 1. Naming Conventions
6- Experiment Name: `<project-name>-<module>-<major-version>`
7  Example: `staywell-churn-prediction-v2`
8- Run Name: `<algorithm>-<key_param>-<timestamp_or_tag>`
9  Example: `gbdt-trees200-depth4-lr005`
10  Prohibited: `test_run`, `my_model`, `model_final`, `run_new`
11
12## 2. Mandatory Parameters to Log
13Every run must explicitly record:
14- `random_seed`: Integer seed for random number generation
15- `dataset_hash`: MD5 or SHA-256 hash of training data
16- `dataset_dvc_pointer`: Relative path to active .dvc file
17- `train_row_count`: Total samples in training split
18- `test_row_count`: Total samples in validation split
19- Full model hyperparameters (no implicit library defaults)
20
21## 3. Mandatory Metrics to Log
22Every classification run must record:
23- Primary metric: `roc_auc` (Validation split)
24- Calibration metric: `brier_score`
25- High-recall threshold metric: `precision_at_10pct_recall`
26- Inference efficiency: `p95_latency_ms` (Benchmarked over 1,000 batch rows)
27
28## 4. Mandatory Tags
29- `git_commit`: Active HEAD commit SHA (automated via CI)
30- `git_branch`: Active working branch
31- `author`: Team member or CI pipeline bot username
32- `execution_target`: `local_dev`, `ci_eval`, or `production_retrain`
33
34## 5. Artifact Retention Rules
35- Exploration runs: Artifacts retained for 30 days, then pruned
36- Candidate runs (tagged `candidate: true`): Retained for 180 days
37- Production runs: Retained indefinitely in primary artifact vault
Following this protocol ensures that every experiment in your repository can be searched, sorted, and audited without institutional friction.
Hands-on implementation: a tested Python run tracker
To understand how experiment tracking systems work internally without relying on external servers, let us build a complete, file-based experiment tracker using the Python standard library.
This implementation provides:
- A context manager for clean run lifecycle management (
RUNNING,FINISHED,FAILED) - Immutable parameter logging
- Time-series metric logging with step tracking
- Binary and file artifact logging into structured run subdirectories
- Key-value metadata tagging
- Automatic serialization to JSON metadata on disk
- Querying and comparison utilities (
list_runsandget_best_run)
The run tracker implementation (run_tracker.py)
Here is the complete implementation:
run_tracker.py
1"""Lightweight, file-based experiment tracker for machine learning runs.
2
3Standard library implementation mirroring MLflow Tracking concepts:
4parameters, step metrics, artifacts, tags, run lifecycle, and run comparison.
5"""
6
7from __future__ import annotations
8
9import dataclasses
10import json
11import os
12import shutil
13import time
14import uuid
15from pathlib import Path
16from typing import Any, Dict, List, Optional
17
18
19@dataclasses.dataclass
20class MetricEntry:
21    value: float
22    step: int
23    timestamp: float
24
25
26class RunContext:
27    """Active execution context for a single experimental run."""
28
29    def __init__(self, run_id: str, run_name: str, runs_dir: Path, tags: Optional[Dict[str, str]] = None) -> None:
30        self.run_id = run_id
31        self.run_name = run_name
32        self.run_dir = runs_dir / run_id
33        self.artifacts_dir = self.run_dir / "artifacts"
34        self.start_time = time.time()
35        self.end_time: Optional[float] = None
36        self.status = "RUNNING"
37
38        self.params: Dict[str, Any] = {}
39        self.metrics: Dict[str, List[MetricEntry]] = {}
40        self.tags: Dict[str, str] = dict(tags or {})
41        self.artifacts: List[str] = []
42
43        self.run_dir.mkdir(parents=True, exist_ok=True)
44        self.artifacts_dir.mkdir(parents=True, exist_ok=True)
45        self._flush()
46
47    def log_param(self, key: str, value: Any) -> None:
48        """Record an immutable input parameter (e.g. hyperparameter or dataset hash)."""
49        self.params[str(key)] = value
50        self._flush()
51
52    def log_params(self, params: Dict[str, Any]) -> None:
53        """Record multiple parameters in one call."""
54        for k, v in params.items():
55            self.params[str(k)] = v
56        self._flush()
57
58    def log_metric(self, key: str, value: float, step: Optional[int] = None) -> None:
59        """Record a scalar evaluation metric, optionally tied to a training step/epoch."""
60        if key not in self.metrics:
61            self.metrics[key] = []
62        cur_step = step if step is not None else len(self.metrics[key])
63        entry = MetricEntry(value=float(value), step=cur_step, timestamp=time.time())
64        self.metrics[key].append(entry)
65        self._flush()
66
67    def log_metrics(self, metrics: Dict[str, float]) -> None:
68        """Record multiple metrics at the current step."""
69        for k, v in metrics.items():
70            self.log_metric(k, v)
71
72    def set_tag(self, key: str, value: str) -> None:
73        """Set a descriptive tag (e.g. git commit, user, model stage)."""
74        self.tags[str(key)] = str(value)
75        self._flush()
76
77    def log_artifact(self, local_file_path: str, subfolder: Optional[str] = None) -> str:
78        """Copy a local binary or text artifact (model weights, plots, configs) into run storage."""
79        src = Path(local_file_path)
80        if not src.exists():
81            raise FileNotFoundError(f"Artifact not found at {local_file_path}")
82
83        dest_dir = self.artifacts_dir if not subfolder else self.artifacts_dir / subfolder
84        dest_dir.mkdir(parents=True, exist_ok=True)
85        dest_file = dest_dir / src.name
86
87        shutil.copy2(src, dest_file)
88        rel_path = str(dest_file.relative_to(self.run_dir))
89        if rel_path not in self.artifacts:
90            self.artifacts.append(rel_path)
91        self._flush()
92        return rel_path
93
94    def finish(self, status: str = "FINISHED") -> None:
95        """Finalize the run and mark its status."""
96        self.status = status
97        self.end_time = time.time()
98        self._flush()
99
100    def _flush(self) -> None:
101        """Serialize run state to JSON metadata on disk."""
102        meta = {
103            "run_id": self.run_id,
104            "run_name": self.run_name,
105            "status": self.status,
106            "start_time": self.start_time,
107            "end_time": self.end_time,
108            "params": self.params,
109            "metrics": {
110                k: [dataclasses.asdict(e) for e in entries]
111                for k, entries in self.metrics.items()
112            },
113            "tags": self.tags,
114            "artifacts": self.artifacts,
115        }
116        with open(self.run_dir / "meta.json", "w", encoding="utf-8") as f:
117            json.dump(meta, f, indent=2)
118
119    def __enter__(self) -> RunContext:
120        return self
121
122    def __exit__(self, exc_type, exc_val, exc_tb) -> None:
123        if exc_type is not None:
124            self.set_tag("error", str(exc_val))
125            self.finish(status="FAILED")
126        else:
127            self.finish(status="FINISHED")
128
129
130class ExperimentTracker:
131    """Manages experiment directory storage and run querying."""
132
133    def __init__(self, tracking_dir: str = "./mlruns") -> None:
134        self.tracking_dir = Path(tracking_dir)
135        self.tracking_dir.mkdir(parents=True, exist_ok=True)
136
137    def start_run(
138        self,
139        run_name: Optional[str] = None,
140        tags: Optional[Dict[str, str]] = None,
141    ) -> RunContext:
142        """Create and start a new experimental run context."""
143        run_id = uuid.uuid4().hex[:8]
144        name = run_name or f"run_{run_id}"
145        return RunContext(
146            run_id=run_id,
147            run_name=name,
148            runs_dir=self.tracking_dir,
149            tags=tags,
150        )
151
152    def list_runs(self) -> List[Dict[str, Any]]:
153        """Load metadata for all runs in the tracking directory."""
154        runs = []
155        for child in sorted(self.tracking_dir.iterdir()):
156            meta_path = child / "meta.json"
157            if meta_path.is_file():
158                with open(meta_path, "r", encoding="utf-8") as f:
159                    runs.append(json.load(f))
160        return runs
161
162    def get_best_run(self, metric: str, mode: str = "max") -> Optional[Dict[str, Any]]:
163        """Find the best run based on the latest value of a specified metric."""
164        runs = [r for r in self.list_runs() if r["status"] == "FINISHED" and metric in r["metrics"]]
165        if not runs:
166            return None
167
168        def extract_latest_metric(run: Dict[str, Any]) -> float:
169            series = run["metrics"][metric]
170            return series[-1]["value"]
171
172        if mode == "max":
173            return max(runs, key=extract_latest_metric)
174        elif mode == "min":
175            return min(runs, key=extract_latest_metric)
176        else:
177            raise ValueError("mode must be 'max' or 'min'")
The unit test suite (run_tracker_test.py)
Here is the test suite validating execution persistence, multi-epoch metric tracking, artifact copying, failure handling, and multi-run comparison:
run_tracker_test.py
1"""Unit tests for the experiment run tracker."""
2
3import json
4import shutil
5import tempfile
6import unittest
7from pathlib import Path
8from run_tracker import ExperimentTracker
9
10
11class TestExperimentTracker(unittest.TestCase):
12
13    def setUp(self):
14        self.test_dir = tempfile.mkdtemp(prefix="test_mlruns_")
15        self.tracker = ExperimentTracker(self.test_dir)
16
17    def tearDown(self):
18        shutil.rmtree(self.test_dir)
19
20    def test_run_lifecycle_and_persistence(self):
21        with self.tracker.start_run(run_name="staywell_baseline", tags={"env": "test", "author": "alex"}) as run:
22            run.log_param("n_estimators", 100)
23            run.log_param("learning_rate", 0.1)
24            run.log_metric("roc_auc", 0.82)
25            run_id = run.run_id
26
27        meta_path = Path(self.test_dir) / run_id / "meta.json"
28        self.assertTrue(meta_path.is_file())
29
30        with open(meta_path, "r", encoding="utf-8") as f:
31            data = json.load(f)
32
33        self.assertEqual(data["run_name"], "staywell_baseline")
34        self.assertEqual(data["status"], "FINISHED")
35        self.assertEqual(data["params"]["n_estimators"], 100)
36        self.assertEqual(data["metrics"]["roc_auc"][0]["value"], 0.82)
37        self.assertEqual(data["tags"]["author"], "alex")
38        self.assertIsNotNone(data["end_time"])
39
40    def test_step_metrics_tracking(self):
41        with self.tracker.start_run(run_name="loss_trajectory") as run:
42            for epoch, loss in enumerate([0.55, 0.42, 0.31, 0.22]):
43                run.log_metric("loss", loss, step=epoch)
44            run_id = run.run_id
45
46        meta_path = Path(self.test_dir) / run_id / "meta.json"
47        with open(meta_path, "r", encoding="utf-8") as f:
48            data = json.load(f)
49
50        loss_series = data["metrics"]["loss"]
51        self.assertEqual(len(loss_series), 4)
52        self.assertEqual(loss_series[0]["step"], 0)
53        self.assertEqual(loss_series[3]["value"], 0.22)
54
55    def test_artifact_logging(self):
56        artifact_src = Path(self.test_dir) / "dummy_model.bin"
57        artifact_src.write_bytes(b"PKL_MODEL_WEIGHTS_42")
58
59        with self.tracker.start_run(run_name="artifact_run") as run:
60            saved_rel_path = run.log_artifact(str(artifact_src), subfolder="models")
61            run_id = run.run_id
62
63        logged_artifact = Path(self.test_dir) / run_id / saved_rel_path
64        self.assertTrue(logged_artifact.is_file())
65        self.assertEqual(logged_artifact.read_bytes(), b"PKL_MODEL_WEIGHTS_42")
66
67    def test_compare_runs_and_best_run(self):
68        # Run 1: AUC = 0.81
69        with self.tracker.start_run(run_name="run_1") as r1:
70            r1.log_param("max_depth", 3)
71            r1.log_metric("roc_auc", 0.81)
72
73        # Run 2: AUC = 0.86 (Best)
74        with self.tracker.start_run(run_name="run_2") as r2:
75            r2.log_param("max_depth", 5)
76            r2.log_metric("roc_auc", 0.86)
77
78        # Run 3: AUC = 0.79
79        with self.tracker.start_run(run_name="run_3") as r3:
80            r3.log_param("max_depth", 2)
81            r3.log_metric("roc_auc", 0.79)
82
83        all_runs = self.tracker.list_runs()
84        self.assertEqual(len(all_runs), 3)
85
86        best_max = self.tracker.get_best_run("roc_auc", mode="max")
87        self.assertIsNotNone(best_max)
88        self.assertEqual(best_max["run_name"], "run_2")
89        self.assertEqual(best_max["params"]["max_depth"], 5)
90
91        best_min = self.tracker.get_best_run("roc_auc", mode="min")
92        self.assertEqual(best_min["run_name"], "run_3")
93
94    def test_run_failure_handling(self):
95        try:
96            with self.tracker.start_run(run_name="failing_run") as run:
97                run.log_param("batch_size", 64)
98                run_id = run.run_id
99                raise RuntimeError("CUDA out of memory simulation")
100        except RuntimeError:
101            pass
102
103        meta_path = Path(self.test_dir) / run_id / "meta.json"
104        with open(meta_path, "r", encoding="utf-8") as f:
105            data = json.load(f)
106
107        self.assertEqual(data["status"], "FAILED")
108        self.assertEqual(data["tags"]["error"], "CUDA out of memory simulation")
109
110
111if __name__ == "__main__":
112    unittest.main()
Save both files in the same folder and run the tests from that folder:
1python3 -m unittest discover -p '*_test.py'This self-contained toolkit illustrates the essential mechanics of experiment tracking: recording inputs, outputs, artifacts, and execution state into structured, durable storage.
Mistakes beginners make
1. Tracking runs in ad-hoc spreadsheets
Engineers frequently maintain a Google Sheet or Excel file where they manually record parameters and test scores. Inevitably, team members forget to enter runs, mistype floating-point numbers, or fail to record the Git commit hash, making the spreadsheet unreliable within a month.
Fix: Automate experiment tracking inside the training script itself. Use SDK calls like mlflow.log_params() and mlflow.log_metrics() directly within your training code, eliminating manual data entry.
2. Forgetting to log the random seed and data hash
Logging hyperparameters like learning_rate and max_depth without logging the random_seed and dataset version hash creates an illusion of reproducibility. If the data changed or random splits were unseeded, executing the same hyperparameters yields different model weights.
Fix: Treat the random seed and dataset version hash as mandatory parameters. Always record both in every run context alongside model hyperparameters.
3. Storing heavy artifacts in local git repositories
Beginners often save trained .pkl or .onnx files into their working directory and run git add models/model.pkl. This causes repository bloat and slows down collaboration.
Fix: Keep binary artifacts out of Git. Log artifacts through your experiment tracking system, which stores them in durable object storage (such as Amazon S3) and associates them with the run record.
4. Selecting models based solely on a single metric
Teams frequently pick the model version with the highest test set score without verifying inference latency, memory consumption, or edge-case slice performance. A model that improves accuracy by 0.5% but requires ten times more RAM or violates live API latency SLAs should not be promoted.
Fix: Define a multi-metric evaluation gate. Compare candidate runs against both predictive quality thresholds and operational constraints (such as p95 latency and memory size) before nominating a model for deployment.
Recap and try it yourself
In this lesson, you explored how experiment tracking replaces informal notes and spreadsheets with a reproducible, queryable database:
- An experiment run record captures four foundational pillars: immutable parameters, scalar and time-series metrics, binary artifacts, and contextual metadata.
- MLflow Tracking decouples metadata stored in relational databases from binary artifacts stored in scalable cloud object stores.
- Run comparison requires evaluating multi-metric trade-offs, balancing predictive accuracy against operational latency and resource constraints.
- An operational tracking protocol enforces standardized naming, mandatory parameter logging, and artifact retention rules.
- A lightweight, file-based tracker demonstrates how run lifecycles, artifact persistence, and candidate selection operate under the hood.
Try it yourself
To gain hands-on experience with experiment tracking on your local machine:
- Run the tracker: Copy
run_tracker.pyandrun_tracker_test.pyinto a local directory and runpython3 -m unittest run_tracker_test.py. Confirm that all five unit tests pass. - Track a hyperparameter grid sweep: Write a Python script that loops over three values of
learning_rate([0.01, 0.05, 0.1]) and three values ofmax_depth([3, 4, 5]). For each combination, start a tracked run, log the parameters, simulate training, and log validation AUC and latency. - Query the winning run: Call
tracker.get_best_run("roc_auc", mode="max")to identify the best configuration programmatically. - Enforce an operational SLA: Filter the runs to find configurations that achieve
roc_auc > 0.85while maintainingp95_latency < 5.0milliseconds.