
Forward Deployed Engineer course · lesson 15 of 24
- 1What Is a Forward Deployed Engineer?
- 2A Day in the Life of a Forward Deployed Engineer
- 3FDE Career Paths, Tiers, and Interview Gates
- 4Build Your Forward Deployed Engineer Skill Map
- 5Requirements Gathering with a Customer
- 6Discovery, Scoping, and Sequencing Customer Work
- 7Audit Customer Data Before You Build
- 8Enterprise Workflow, Business Value, and ROI
- 9Choosing an AI Approach for a Customer
- 10Build a Working Prototype Fast
- 11Integration Engineering and the Last Mile
- 12Working Safely with Legacy Systems
- 13Data Pipelines for AI Features
- 14Evals as Acceptance Criteria
- 15Debugging Agent Logic and Observability
- 16Deploying in the Customer's Cloud
- 17Cost, Latency and Inference Choices
- 18Security, Privacy and AI Governance
- 19Stakeholders and Communication
- 20Technical Writing for Handoff
- 21UAT, Go-Live, and Day 2 Operations
- 22Executive Reporting and Proving ROI
- 23The Product Feedback Loop
- 24Capstone: Run an Engagement End to End
After this lesson, you will be able to follow a reported AI failure from the customer's description to the component that likely caused it, request a minimal set of logs and traces, and write down what should be redacted before evidence leaves the customer's environment. You will use a triage checklist for a fictional NorthPort Freight dispatch assistant. The example records are synthetic and contain no customer data.
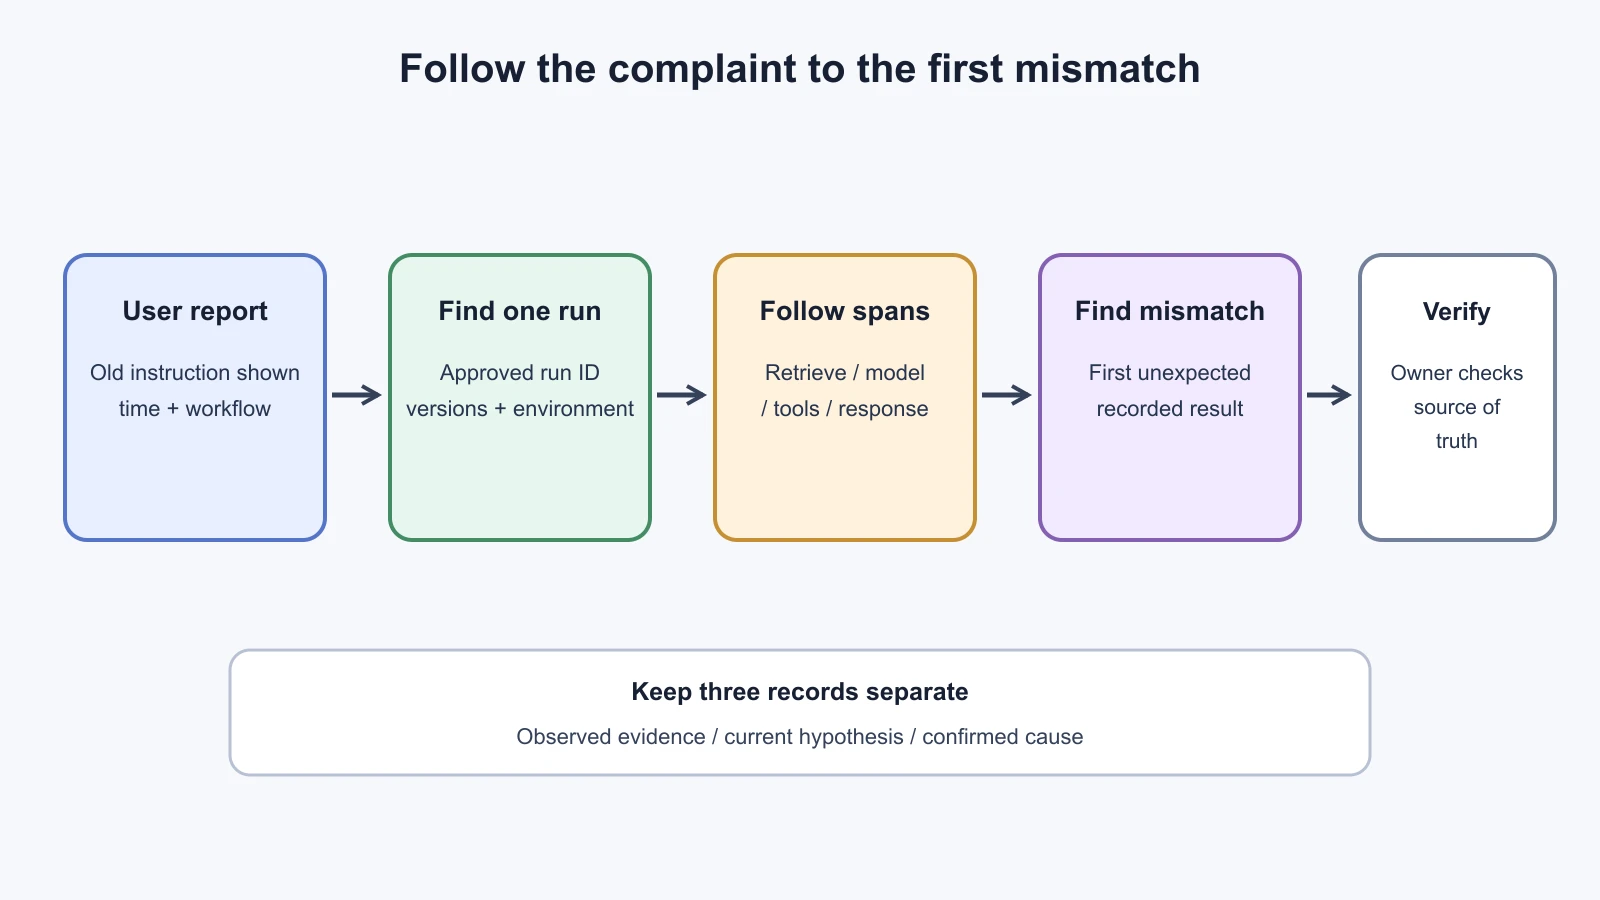
A dispatcher says, "The assistant gave me the old loading instruction." That report is valuable, but it does not yet tell you whether the source document was stale, retrieval missed a newer document, the model ignored a retrieved passage, or the interface displayed an earlier answer. Debugging starts by turning the report into one specific run that the team can inspect.
Observability is the ability to infer what a system did from the evidence it produces while running. For an AI feature, that evidence can include logs, metrics, and traces. A log is a record of an event. A metric is a numerical measurement over time, such as the number of retrieval failures per hour. A trace shows the path of one request through components. These signals answer different questions and are more useful together than alone. OpenTelemetry defines traces as request paths, metrics as runtime measurements, and logs as event records; its terms are widely used, although a customer's tools and data model may differ.
The AI Agents lesson on observability and tracing introduces tracing concepts and tooling. The companion lessons on testing AI agents and Prompt Engineering's debugging a failing prompt cover broader test and prompt techniques. This lesson focuses on the field problem: what the customer can share, what the trace does and does not prove, and how to investigate without expanding access unnecessarily.
Turn the report into one run
Start by asking when the issue happened, what task the user was trying to complete, what the interface showed, and whether the user took an action based on it. Ask for a request or correlation ID if the application displays one. Do not begin by asking for a screenshot containing names, addresses, delivery details, or an entire conversation. First see whether the customer can find a run by a timestamp, a synthetic case, or an identifier that does not expose content.
Agree on a time zone and a narrow time window. "It happened this morning" can cover several hours and multiple system versions. Record the approximate time with its zone, the customer environment, feature version, and user-visible symptom. Ask whether other users saw the same behavior and whether it began after a known change. These details help form a hypothesis; they are not proof of a cause.
In the fictional NorthPort case, a dispatcher reports an old loading instruction at 09:20 local time. The team first checks the UI event record and finds run ID run-np-204. The run used assistant version dispatch-0.8, prompt revision p17, and retrieval index procedures-42. The customer confirms a newer procedure was approved the previous afternoon. These labels are synthetic. They let us walk the debugging method without pretending to have accessed a real customer system.
Write a one-sentence symptom before proposing a fix: "For run run-np-204, the dispatcher saw an answer citing procedure P-12, although procedure P-19 had already been approved for this workflow." If that statement is wrong, the customer can correct it. A shared description is a better starting point than an early diagnosis such as "the model hallucinated" because the latter assumes the source of failure before the trace has been inspected.
Follow the trace in order
A span is one recorded operation within a trace, such as a retrieval request, model response, or tool call. Spans have a start time, duration, outcome, and relationships to other spans. A trace groups related spans under a shared request context. In a multi-step agent, this lets the team see the sequence and identify where an unexpected result first appears. OpenAI's tracing documentation, for example, describes a trace with model responses, tool calls, and delegated work, and spans with timing, status, and recorded data. That is one vendor's interface, not a requirement to use its service.
Begin at the outer request and move inward. Confirm that the trace belongs to the right environment and run ID. Check the application span first: which assistant version handled the request, and did the run complete or time out? Then inspect retrieval: which index or source version was queried, how many records were returned, and which source identifiers were included? Continue to the model input and output, then any tool calls, guardrails, and the final response delivered to the interface.
For the synthetic NorthPort trace, the request completed normally. Retrieval queried procedures-42 and returned P-12, although the approved document registry lists P-19 as current. The model response cites P-12, the response passes through the API, and the interface displays it. This sequence points first toward indexing, document selection, or an update delay. It does not yet establish why the newer procedure was missing. The trace shows the record that the retriever returned, not whether the customer approved the source registry or why the indexing job did not include the document.
Use the earliest unexpected span as a lead. If retrieval returns the wrong passage, a prompt edit is unlikely to fix the root cause. If retrieval returns the correct passage but the model ignores a key limitation, inspect the prompt, model input, and output. If the model output is correct but the UI shows something else, follow the API and rendering spans. If a tool call changes a record, inspect its arguments, authorization result, and effect using the customer's approved audit channel. A plausible trace path narrows the search; it does not replace component-level verification.
Look at duration and status as well as content. A timeout can trigger a fallback path. A retry can return a different result or duplicate a write if the boundary is not idempotent. A tool error can be swallowed and rendered as an empty result. A successful status may mean only that the call returned, not that it returned the right record. Compare the span's output with the contract and the customer-approved source of truth.
If the trace is incomplete, note the gap. Some systems sample traces, omit payloads, delay trace creation, or do not propagate a request ID across every service. A missing span means "not recorded here," not "did not happen." Record which components have no evidence and ask their owners for a permitted alternate record. Avoid reconstructing a story from timestamps that may come from machines with unsynchronized clocks.
Separate evidence from explanation
Keep three things distinct in the incident note: observed evidence, current hypothesis, and confirmed cause. For example:
| Type | NorthPort example |
|---|---|
| Evidence | Trace run-np-204 shows index procedures-42 returned source P-12; the UI displayed the model response citing P-12. |
| Hypothesis | The approved update to P-19 may not have reached the retrieval index. |
| Confirmed cause | Pending: the data pipeline owner has not yet checked the ingestion run or registry event. |
The distinction matters when a customer asks whether the issue is fixed. A trace can establish what was recorded for one request. It cannot alone prove that every user saw the same path, that all source updates were delayed, or that a prompt caused the answer. Ask the component owner to confirm the relevant state using its source of truth. Preserve the original evidence before applying a fix, then use a new run to verify the change.
Reproduction should be controlled and minimal. First replay the exact request in a safe non-production environment if the customer permits it and if the source data can be copied under their policy. If not, use a synthetic case with the same structure and a sanitized trace. Keep the prompt, model, retrieval index, tool configuration, and feature version fixed when trying to reproduce one suspected cause. Change one variable at a time and record each candidate. If production behavior depends on live data, user permissions, or timing, a local replay may not reproduce it. State that limit instead of claiming a negative result proves the issue is gone.
Sometimes replaying a production trace is unsafe. It may call a real tool, send a message, update an order, or trigger a costly external service. Prefer a read-only replay mode, a customer sandbox, or a stubbed tool response. Confirm whether retries or replays can cause side effects before invoking them. If there is no safe path, inspect the recorded trace without rerunning it and ask the system owner to validate a proposed change separately.
The debugging outcome should be testable. If the fault was a delayed index update, add a check that the approved document appears in the index within the agreed freshness window, and a regression case that verifies the assistant can cite it. If the issue was a missing authorization boundary, test both an allowed and denied user. If the problem was an unclear prompt, add examples for the edge case and make the acceptance criterion explicit. Lesson 14's customer acceptance evals explains how to keep those checks attached to approved criteria.
Collect less, but collect enough
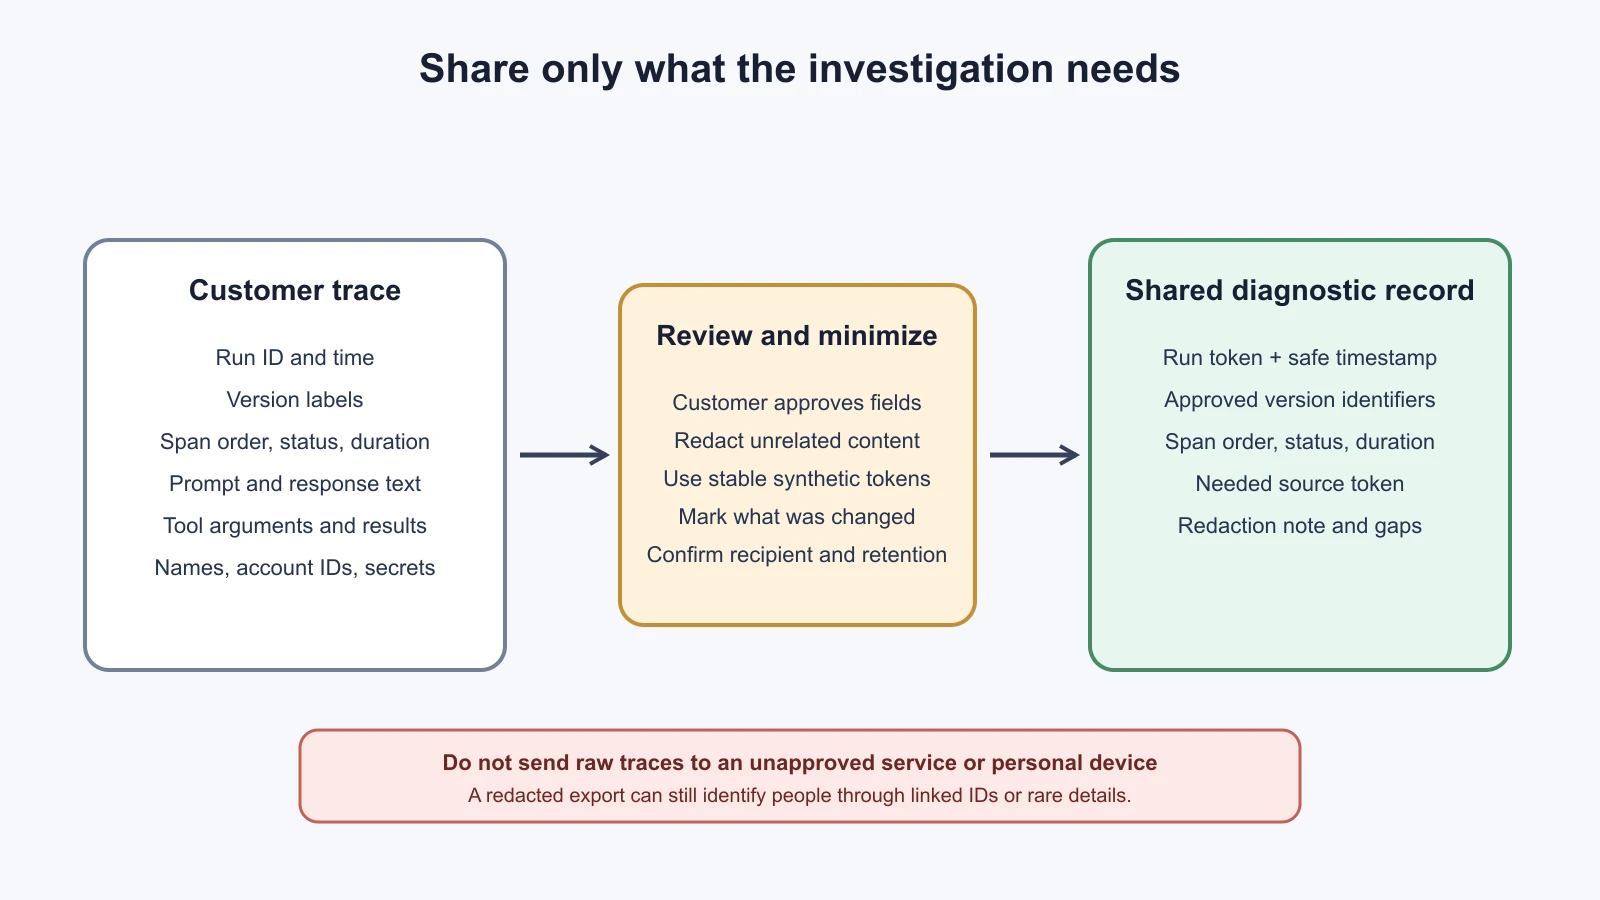
Logs and traces can contain far more than operational metadata. A trace may store prompts, retrieved passages, tool arguments, response text, account IDs, or a customer name. A request ID may itself link to a customer record. Removing obvious names does not automatically make a trace anonymous. Treat each field according to the customer's classification and the system's data-handling agreement.
NIST's SP 800-122 gives U.S. federal agencies context-based guidance for protecting personally identifiable information. It is useful background for identifying sensitivity and choosing safeguards, but it is not a substitute for the customer's own policy, contract, or applicable rules. NIST SP 800-92 describes organization-wide log-management practices, including configuring sources, analyzing logs, responding to events, and managing retention. It dates from 2006, so use it for these broad management themes and check current customer and regulatory requirements for implementation details.
Before asking for evidence, decide where it will be stored, who can view it, how long it is needed, and how it will be deleted. Ask the customer to export a narrow trace from their approved tool if that is safer than granting you console access. If access is needed, request the smallest role, project, and time window that supports the investigation. Do not use personal accounts, copy data to a personal device, or paste raw trace contents into an unrelated assistant or ticketing service.
Redact or omit content that is not needed to diagnose the issue. Prefer a stable case token over a person's name. Keep a source identifier only if the customer approves it and it is needed to identify which version was retrieved. Replace customer text with a short placeholder when the exact words are not required. Preserve the event ordering, timestamps, duration, status, component names, and safe version identifiers if they matter to the fault. The customer should decide whether the sanitized record is safe to share.
Redaction can remove context that matters. If a name or field value appears to trigger a routing rule, replace it with a consistent synthetic token rather than deleting the field. Note which fields were changed and how. Never claim a trace is complete if payloads were removed or spans were sampled. A redacted trace is a useful diagnostic artifact, but it may not be sufficient to reproduce the exact output.
Use a field triage checklist
The checklist below is designed to copy into a customer incident ticket. Agree the response process and data-sharing rules with the customer before an incident. Fill in unknown items as unknown, not as assumptions. The list is a working record, not a substitute for the customer's incident process.
| Area | Questions and evidence to record |
|---|---|
| Report | What did the user expect? What did the system show or do? When did it happen, including time zone? Is there an approved run or request ID? |
| Scope | One user or several? One workflow or other workflows too? Is the issue still happening? Is there an unsafe action, data exposure, or customer operation at risk? |
| Versions | Which environment, application, prompt, model, retrieval index, source snapshot, tools, and policy version were active? Mark missing version information as unknown. |
| Trace | Which spans exist? What order did they run in? Where is the first mismatch? What are the statuses and durations? Were retries, fallbacks, or handoffs involved? |
| Data | Which source IDs or fields are necessary? Who owns the source of truth? Is the content approved for sharing? What must be redacted, and who will verify the export? |
| Reproduction | Can the issue be replayed safely in a sandbox or read-only mode? Which settings stay fixed? What side effects could a replay trigger? What limitation remains if it cannot be reproduced? |
| Hypothesis | What does the evidence show? What is only a hypothesis? Which component owner can confirm or disprove it? What is the next low-risk check? |
| Containment | Does the customer need to pause a feature, disable a tool, switch to a manual path, or roll back? Who has authority to make that decision? |
| Follow-up | What fix or test is proposed? How will the customer verify it? Who owns the next update, by when, and where will the sanitized evidence be retained or deleted? |
Severity is not a label the FDE should invent alone. Ask the customer who decides whether an event is an incident, who can pause a feature, and how quickly stakeholders must be notified. If there is a credible risk of data exposure, unauthorized action, or operational harm, use the agreed escalation route immediately. Do not wait for a complete root-cause analysis before telling the responsible owner what is known.
Close the loop in plain language. State the observed behavior, the affected workflow, what was checked, what remains uncertain, what immediate safeguard is in place, and when the next update will arrive. Do not say "fixed" until the customer has seen the verification that matters to them. Add an anonymized failure case to the test set only after the owner approves the content and retention approach.
Mistakes beginners make
Calling every bad answer a hallucination. The output may reflect stale retrieval, an application cache, a tool result, or a UI rendering problem. The label guesses at a cause before checking the path.
Fix: Follow the recorded run from the request to the visible response and find the first mismatch. Keep the cause provisional until its owner confirms it.
Requesting a full conversation export by default. Conversation history may include unrelated personal or business details, and most of it may not help identify the failing component.
Fix: Ask first for a run ID, a narrow time window, and the smallest approved set of spans. Let the customer review and redact the export.
Assuming a missing span proves a component was skipped. Sampling, export limits, delayed trace creation, or broken context propagation can leave the record incomplete.
Fix: Note the observability gap and seek a permitted record from the component owner. Keep absence of evidence distinct from evidence of absence.
Replaying a trace against live tools without checking side effects. A retry can send another notification or repeat a write.
Fix: Use a sandbox, read-only path, or stub where possible. Confirm replay behavior with the system owner before running it.
Recap and try it yourself
Turn the customer's report into one run, follow its trace from the outside in, and look for the first mismatch. Separate what the trace shows from your explanation of why it happened. Use a controlled replay only when it is safe and permitted. Logs, metrics, and traces can help explain a failure, but each has gaps and may carry sensitive data. Request the smallest useful evidence, preserve its versions and limits, and let the customer control access and sharing.
Try it yourself: use the synthetic NorthPort report about the old loading instruction. Write down the evidence, hypothesis, and one unanswered question. Then fill in the triage checklist and choose one safe next check. Name the fields you would keep in a shared trace and the fields you would ask the customer to redact. Finally, draft a two-sentence status update that explains what is known and when you will report back without claiming a cause that has not been confirmed.
Sources
Checked on 5 November 2026. OpenTelemetry's signals overview supports the definitions of traces, metrics, and logs. OpenAI's tracing documentation supports the vendor-specific example of sessions, turns, spans, recorded inputs and outputs, timing, and status. NIST SP 800-122 supports context-based PII identification and confidentiality safeguards for U.S. federal agencies. NIST SP 800-92 supports general log-management practices and is an older high-level guide. NorthPort is fictional; all case details are synthetic.