
Forward Deployed Engineer course · lesson 22 of 24
- 1What Is a Forward Deployed Engineer?
- 2A Day in the Life of a Forward Deployed Engineer
- 3FDE Career Paths, Tiers, and Interview Gates
- 4Build Your Forward Deployed Engineer Skill Map
- 5Requirements Gathering with a Customer
- 6Discovery, Scoping, and Sequencing Customer Work
- 7Audit Customer Data Before You Build
- 8Enterprise Workflow, Business Value, and ROI
- 9Choosing an AI Approach for a Customer
- 10Build a Working Prototype Fast
- 11Integration Engineering and the Last Mile
- 12Working Safely with Legacy Systems
- 13Data Pipelines for AI Features
- 14Evals as Acceptance Criteria
- 15Debugging Agent Logic and Observability
- 16Deploying in the Customer's Cloud
- 17Cost, Latency and Inference Choices
- 18Security, Privacy and AI Governance
- 19Stakeholders and Communication
- 20Technical Writing for Handoff
- 21UAT, Go-Live, and Day 2 Operations
- 22Executive Reporting and Proving ROI
- 23The Product Feedback Loop
- 24Capstone: Run an Engagement End to End
After this lesson, you will be able to write a one-page executive summary, compare a result with a baseline, track time-to-value, and explain what an ROI estimate does and does not establish. NorthPort Freight is fictional; the report examples contain no claimed customer outcomes.
An executive update should help a leader understand what changed, whether the work is producing the intended result, what remains uncertain, and what decision is needed. It is not a compressed project diary. A list of completed tickets tells a sponsor that the team was busy; it does not show whether the customer’s workflow improved or whether the next investment is justified.
Start with the value hypothesis from Enterprise Workflow, Business Value, and ROI. That lesson connects a customer task to a measurable outcome and a baseline. This lesson turns that evidence into a concise report for decision-makers. Keep the claim proportional to the evidence: a prototype test, a limited rollout, and a measured production result support different conclusions.
Build the report around a decision
Executives usually need the intended outcome, current status, meaningful evidence, material risk, and a decision or next step. Put those near the top. Add technical detail only when it changes the decision; link to the deeper report for readers who need the method or case-level evidence. Use words the sponsor understands, and define a metric the first time it appears.
GOV.UK's Service Standard guidance recommends defining what success means, choosing metrics that indicate whether a service solves its intended problem, and using performance data with user research. That guidance applies to public services, but the measurement habit transfers: do not present a metric without the user or business problem it helps assess. The FinOps Framework similarly connects technology decisions to business value and describes collaboration among engineering, finance, and business teams. It is a flexible operating framework, not a prescribed ROI formula.
An executive summary can answer five questions in this order:
- What outcome are we trying to improve? Name the customer workflow and the agreed measure.
- What changed? State the deployed or tested change and the period or population covered.
- What does the evidence show? Compare the current measure with the baseline and include important quality or safety checks.
- What is uncertain or at risk? Identify limits, dependencies, data gaps, and owners.
- What do you need from the reader? Ask for a specific decision, resource, or acceptance by a date, or state that no decision is needed.
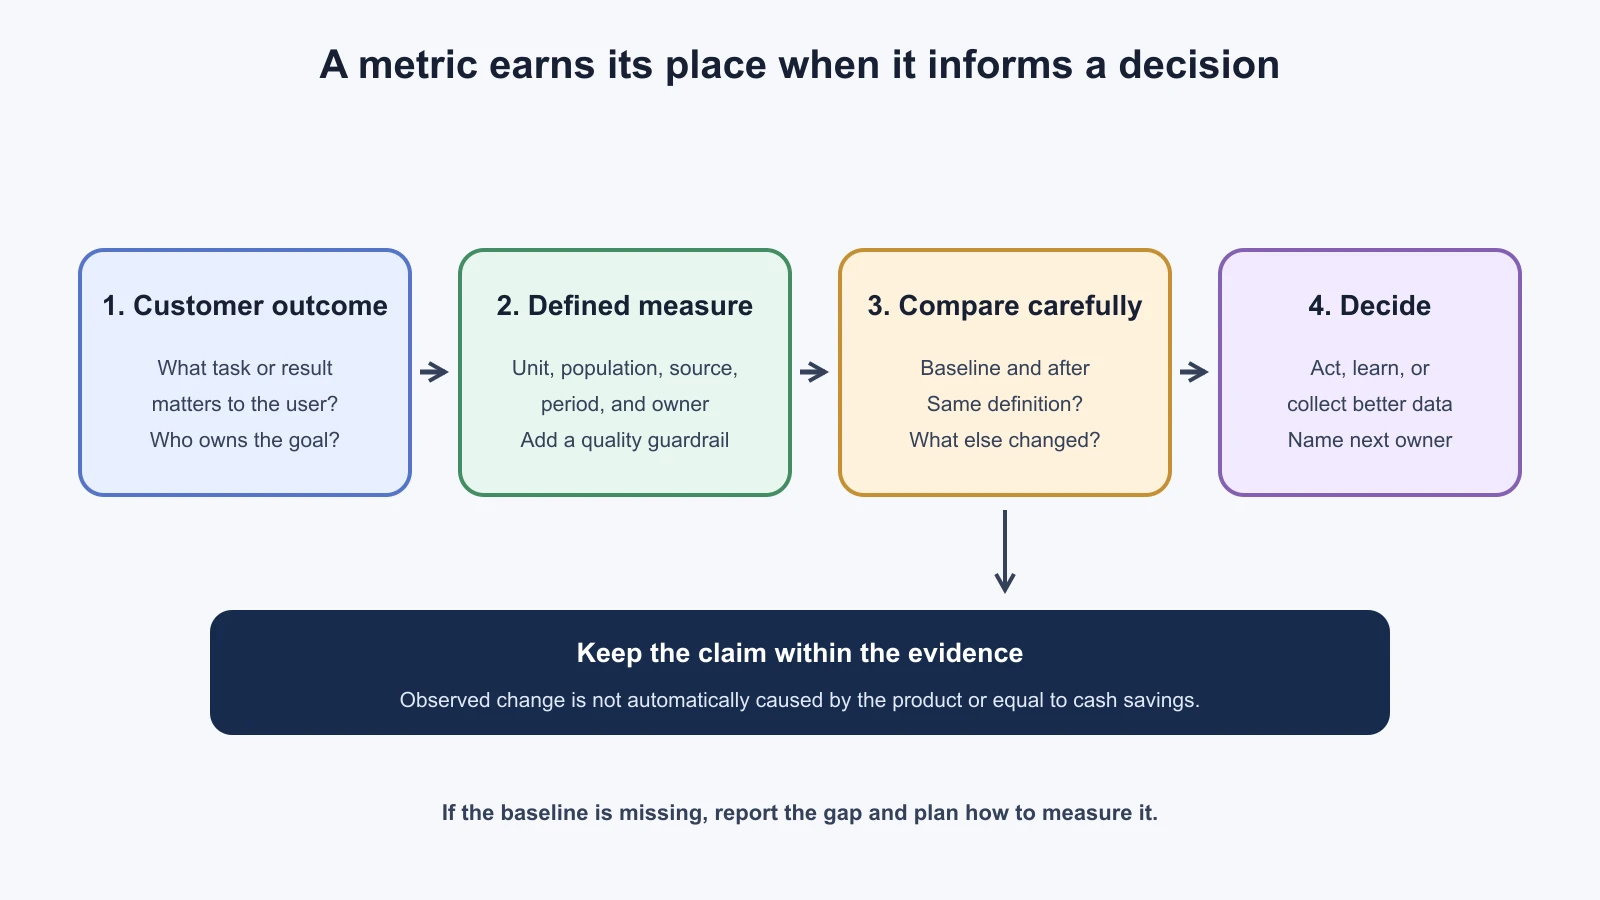
Do not make the reader infer status from color alone. If you use red, amber, or green, define the criteria and add a sentence explaining the status. A green label should not hide a risk in the detail. If the status changed since the previous update, say why. If the project is blocked, name the blocker, its impact, who owns it, and the next decision point.
Compare the baseline with what happened
A baseline is the measurement of the existing process before a change. Use the same definition, data source, population, and collection method when you compare it with the period after rollout. If the task mix, staffing, season, or source system changed, mention that. A difference between two measurements is evidence of change over time; by itself, it does not prove that the new system caused the difference.
For example, a lower median review time after introducing an assistant may be encouraging. But perhaps the team handled fewer complex exceptions that week, changed a dispatch policy, or stopped recording cases that took longest. Report the observed difference and what could explain it. If the customer can compare similar groups, stagger a rollout, or inspect case-level samples, that may help understand attribution. Choose a design appropriate to the customer's constraints; do not imply a causal experiment if the work was a simple before-and-after comparison.
Pair a speed or volume measure with a quality check when faster completion could make errors more likely. In the fictional dispatch workflow, a shorter time to decide might be useful only if incorrect releases, escalation rates, or procedure compliance remain within customer-approved bounds. The customer’s process owner decides which guardrails matter. A measure that improves while a critical guardrail worsens is not an unqualified success.
Distinguish three kinds of statements in the report:
- Observed: directly measured in the stated period and population, with a known method.
- Estimated: calculated from observations using assumptions, such as an estimated value of staff time.
- Projected: expected future benefit if conditions continue or a larger rollout succeeds.
Keep these labels visible. A forecast is not a realized saving. A reduction in time spent on a task is not automatically a cash reduction; it may free capacity for other work. Only call it cost savings if the customer can show that spending or required capacity actually changed under its accounting method.
If the baseline is missing, do not invent one after the project. Report that the outcome cannot yet be compared, explain what data is needed, and assign an owner and date to establish a baseline or collect a credible historical measure. The GOV.UK performance guidance recommends considering measurement from the start of a project so the team can plan what to collect and how to use it. That is especially useful when a workflow spans systems that do not share a common record.
Track time-to-value honestly
Time-to-value is the time from an agreed starting event to the point when the customer receives a usable result that provides evidence toward the intended outcome. Agree what “usable” and “value” mean before tracking it. A demo using mock data may create learning, but it is not necessarily a usable customer result. A service that is deployed but waiting on an access approval may not yet be available to its intended users.
Choose a start event that is observable, such as kickoff, a signed scope, or the first funded work day. Choose an end event tied to customer use, such as an authorized team completing its first real workflow with the service under the accepted process. Record intermediate milestones too: first approved data access, first usable prototype, first customer-reviewed result, UAT acceptance, and production availability. These help explain delays and show where time went without changing the agreed headline measure later.
Break the timeline into periods the team can act on. Discovery, customer approvals, integration, user review, and operational readiness can have different owners. A long access approval may be important context, but it does not disappear from the elapsed customer timeline. Report elapsed time and explain the major dependency; do not silently exclude inconvenient waiting periods. If comparing engagements, define the start and end consistently and show scope differences.
Time-to-value is not a race to production. Releasing an unsafe or unsupported feature quickly can create cost and risk that overwhelm an early benefit. Pair the time measure with acceptance, safety, quality, and ownership checks. A small, safe outcome that a customer can use may be more valuable than a broad release that is not ready to operate.
Explain ROI without false precision
Return on investment (ROI) compares a benefit attributed to an investment with the investment's cost. One common expression is:
ROI = (benefit - cost) / cost
The percentage looks objective, but both inputs depend on agreed definitions and evidence. Benefit might include avoided expenditure, increased throughput, or time returned to staff. Costs may include discovery, engineering, licenses, model usage, cloud infrastructure, evaluation, user training, support, maintenance, and the customer's time. State the period covered and whether the number is observed, estimated, or projected. If benefits and costs occur over different periods, the customer’s finance team may need a different method than this simple ratio.
Do not multiply every saved minute by a wage and label the total a cash saving. That calculation may estimate the value of capacity, but it does not prove the organization reduced payroll or spending. Say “estimated staff capacity released” if that is what the evidence supports, and ask the customer how it values that capacity. If the system shifts work from dispatchers to supervisors or platform staff, include that operational cost rather than counting only the user's time.
AI projects have additional costs that can be easy to omit: human review of uncertain answers, correction of source data, incident response, evaluation maintenance, and rechecking behavior after model or prompt changes. The lesson on Cost, Latency, and Inference covers model and serving costs. Work with finance and service owners to decide which costs belong in the calculation; do not present a partial technical bill as total cost of ownership.
When no credible monetary value is available, report the operational outcome without forcing it into dollars. A reduction in a queue, improved completion, better traceability, or increased user confidence may matter to the customer even when it is not converted into a financial estimate. Explain what evidence exists and what further measurement would be needed for an ROI claim.
One-page executive summary template
Keep the summary short enough to scan. Link to the full measurement method, UAT results, and detailed cost record. Replace placeholders with approved information; write “not measured” when evidence is unavailable.
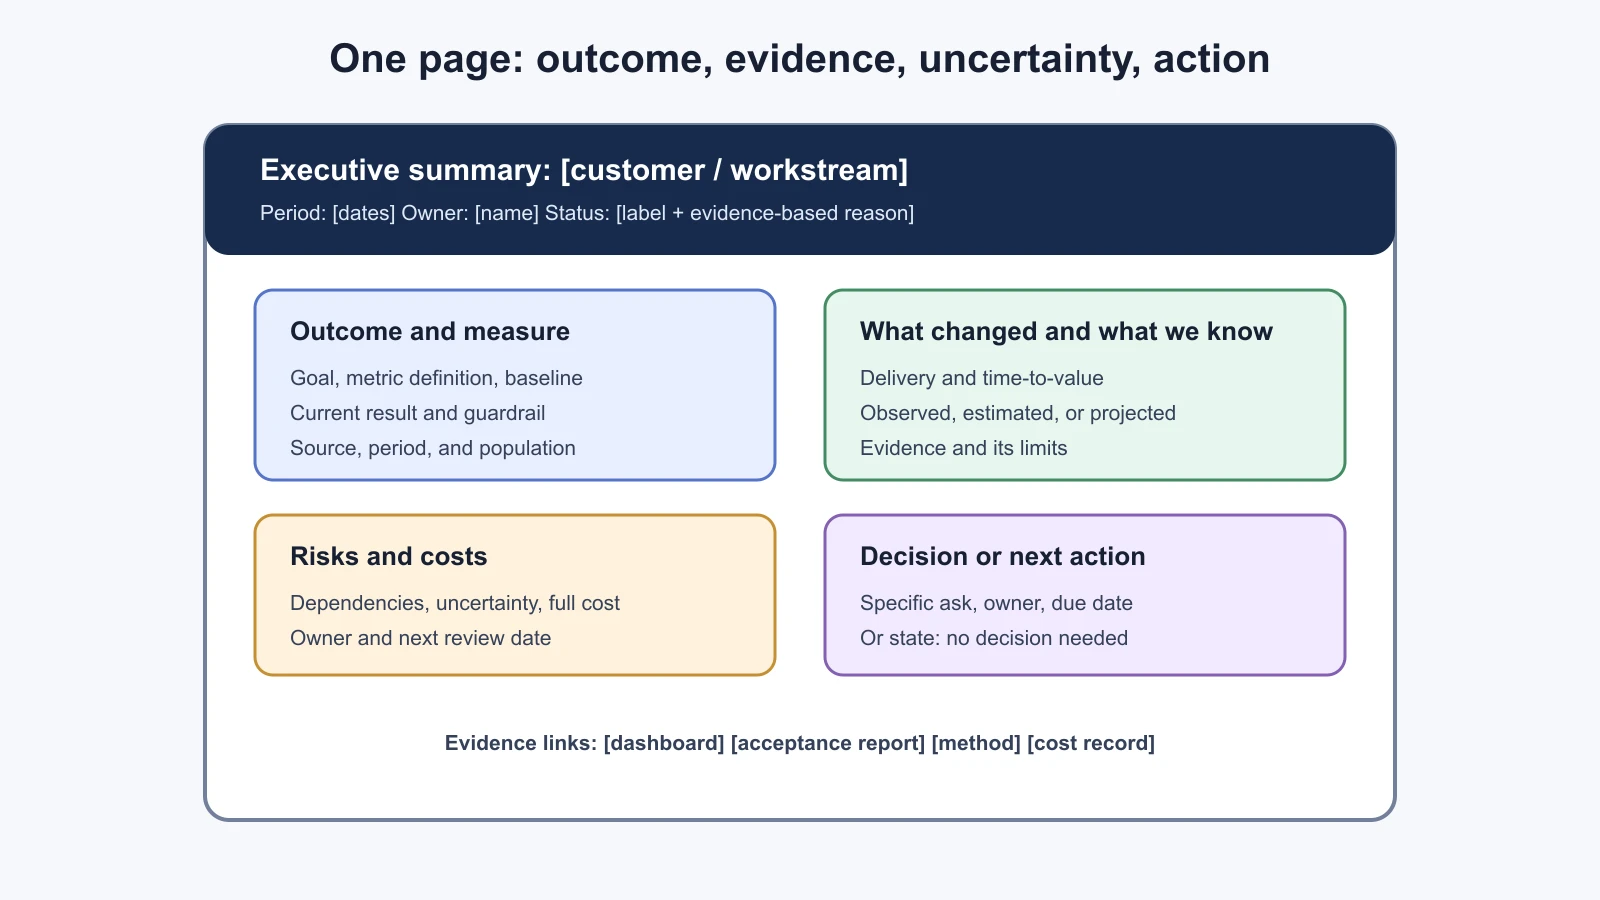
1Executive summary: [customer / workstream]
2Reporting period: [dates]
3Prepared by: [owner]
4Status: [label] because [one-sentence evidence-based reason]
5
6Outcome
7- Customer goal: [workflow or business outcome]
8- Measure and definition: [metric, unit, population]
9- Baseline: [value or not measured, period, source]
10- Current result: [value, period, source]
11- Guardrail: [quality or risk measure and result]
12
13What changed
14- [change delivered or tested, version, user group]
15- Time-to-value: [start event, first usable result, elapsed time]
16
17What the evidence supports
18- [observed result and comparison]
19- [estimate or projection, clearly labelled]
20- Limitation: [confounder, sample, missing data, or scope]
21
22Cost and value
23- Costs included: [categories and period]
24- Costs not yet measured: [items and owner]
25- ROI: [calculation or not yet supportable]
26
27Risks and dependencies
28- [risk, customer impact, owner, next review date]
29
30Decision or action needed
31- [specific request, decision owner, due date]
32- If no decision is needed: [state this]
33
34Next measurement or review: [date, measure, responsible owner]
35Evidence links: [dashboard, acceptance report, methodology, cost record]
For the fictional NorthPort assistant, the summary should not claim that dispatchers save time or that the system generated ROI unless the customer has measured those outcomes. A responsible first report might say that UAT was completed for a stated set of cases, production use is still limited, a baseline is being gathered, and the next decision is whether to extend the pilot after a named guardrail review. This is a report structure, not a claim about an actual rollout.
Mistakes beginners make
Reporting activity as value. Tickets closed, prompts edited, and users invited show work performed. They do not show the customer's outcome.
Fix: Lead with the agreed workflow measure, then connect delivery activity to the evidence it produced.
Claiming the change caused every improvement. A before-and-after difference may reflect seasonality, case mix, staffing, policy, or a recording change.
Fix: State the comparison method and plausible confounders. Use causal language only when the evidence supports it.
Presenting a projection as realized savings. A model estimate or potential reduction in time can sound like money already saved.
Fix: Label observed, estimated, and projected values. Ask finance how it recognizes savings and capacity.
Focusing on a vanity metric. High usage, token volume, or answer count can rise even when users do not complete the task.
Fix: Pair activity measures with task outcomes and quality guardrails that the customer values.
Hiding the ask in the appendix. Leaders may miss a decision buried below technical status.
Fix: Put the specific request, owner, and due date near the top or in a clearly labelled final section.
Recap and try it yourself
An executive summary connects the customer goal to evidence, uncertainty, cost, and a next decision. Compare a measure with a defined baseline, keep the method and population visible, and avoid claiming causation from a simple before-and-after result. Track time-to-value from agreed start and usable-result events. Separate observed results from estimates and projections, and calculate ROI only when benefit and cost definitions are approved and supported.
Try it yourself: draft a one-page summary for the fictional NorthPort assistant before any production result exists. State which UAT evidence is available, what baseline is still missing, which quality guardrail needs review, and what decision you would ask the sponsor to make next. Then list the cost categories that finance would need before an ROI calculation. Do not insert invented measurements.
Sources
Checked on 5 November 2026. GOV.UK's Service Standard guidance on defining success supports choosing metrics tied to the problem a service is meant to solve, combining performance data with user research, and using measures to assess changes. Its introduction to using performance data supports measuring task completion and cost efficiency and planning measurement from the start; its mandatory indicators are specific to central government and are not prescribed here for customer work. The FinOps Framework supports collaboration across engineering, finance, and business teams and aligning technology choices with business value; it is a flexible framework rather than an ROI calculation standard. NorthPort and all example report details are fictional.