
Forward Deployed Engineer course · lesson 17 of 24
- 1What Is a Forward Deployed Engineer?
- 2A Day in the Life of a Forward Deployed Engineer
- 3FDE Career Paths, Tiers, and Interview Gates
- 4Build Your Forward Deployed Engineer Skill Map
- 5Requirements Gathering with a Customer
- 6Discovery, Scoping, and Sequencing Customer Work
- 7Audit Customer Data Before You Build
- 8Enterprise Workflow, Business Value, and ROI
- 9Choosing an AI Approach for a Customer
- 10Build a Working Prototype Fast
- 11Integration Engineering and the Last Mile
- 12Working Safely with Legacy Systems
- 13Data Pipelines for AI Features
- 14Evals as Acceptance Criteria
- 15Debugging Agent Logic and Observability
- 16Deploying in the Customer's Cloud
- 17Cost, Latency and Inference Choices
- 18Security, Privacy and AI Governance
- 19Stakeholders and Communication
- 20Technical Writing for Handoff
- 21UAT, Go-Live, and Day 2 Operations
- 22Executive Reporting and Proving ROI
- 23The Product Feedback Loop
- 24Capstone: Run an Engagement End to End
After this lesson, you will be able to estimate the major costs of an AI feature, define response-time measures around the user's task, and compare optimization choices without hiding quality or capacity risks. You will use fictional NorthPort Freight dispatch figures to build an estimate and a workload plan. The figures are teaching assumptions, not market benchmarks or customer results.
Inference is the act of using a trained or hosted model to produce an output for new input. A customer can have a working prototype and still be surprised by its cost or response time when many users rely on it. The first deployment may also see traffic bursts, retries, larger-than-expected prompts, or repeated tool calls. The FDE should make those assumptions visible before anyone treats the prototype's behavior as a production forecast.
The question is not simply "Which model is cheapest?" A less expensive model can require extra attempts, more context, or human correction. A faster response can omit information the dispatcher needs. A larger server can reduce queueing but increase idle capacity cost. The useful decision compares options on the same task, dataset, traffic shape, and service requirements.
OpenAI's current guidance groups latency improvements around reducing work, processing faster, parallelizing independent steps, and shaping the user's wait. Its cost guidance also links cost and latency through request count, token count, model choice, and asynchronous batch processing. The specific API features and prices change, so this lesson uses these as examples of general engineering choices, not a recommendation to select one provider.
Measure the user-visible task
Latency is the time between an event starting and its result becoming available. For a user-facing AI feature, record at least the total time from the user's action to a usable response. If the interface streams output, time to first token is the delay until the first generated text arrives. Also record the time to the complete response; a quick first token does not mean the task finished quickly. Include retrieval, tool calls, network time, model processing, and rendering when those steps are in the user's path.
An average response time can conceal slow experiences. A percentile is a point in an ordered set of measurements: p95 latency is the time at or below which 95 percent of measured requests completed. Agree a target for the percentile that matches the customer's experience and traffic. Capture errors, timeouts, retries, and timeouts separately so failed requests do not disappear from the latency report. Compare like-for-like runs under realistic load, not a single request from a developer laptop.
Start from user need. A dispatcher checking a delivery hold while speaking to a driver may need an answer promptly. A weekly job that summarizes exception patterns can run asynchronously. A longer task may be acceptable if the interface shows progress and provides a reliable completion notice. The customer decides what acceptable means. Write down which user action is timed, which events count as complete, and how the measurement handles a canceled request.
Use one trace to locate delay and aggregate metrics to understand how often it occurs. A trace can show that an answer waited on retrieval, then a model response, then a second tool call. Metrics show whether that pattern is common and whether p95 has changed since a release. Logs add contextual events such as a timeout or fallback. Lesson 15's debugging and observability guide covers how to collect those signals safely.
Map the cost before tuning
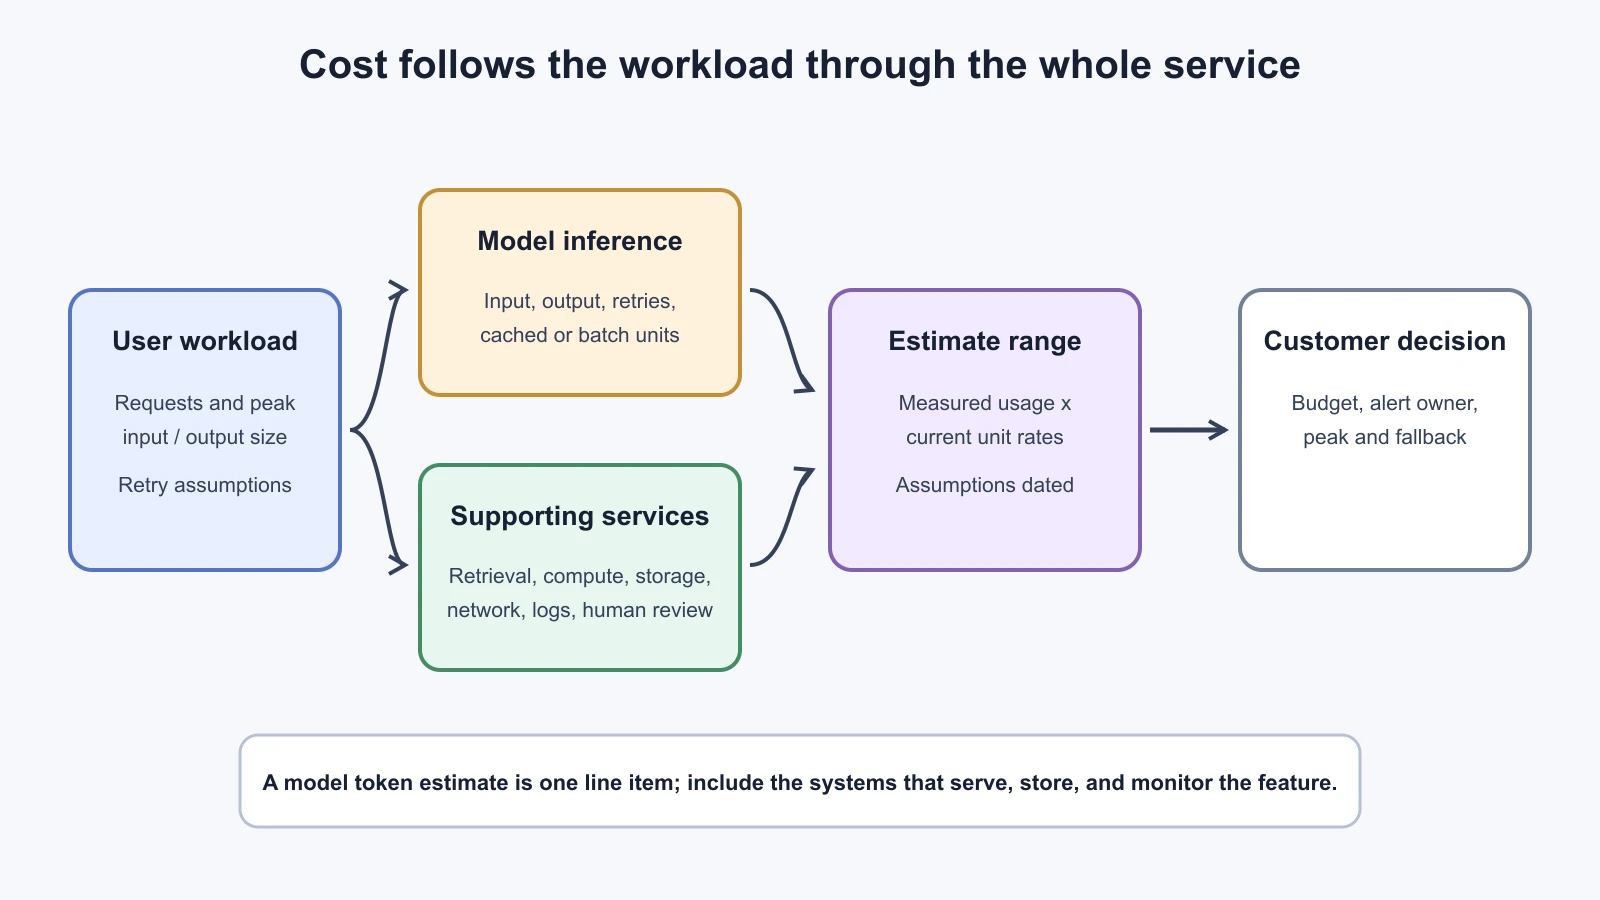
Cost can come from more than model tokens. Depending on the architecture, include input and output tokens, embeddings, reranking, vector or relational storage, compute, network transfer, logging and trace storage, evaluation runs, and human review or support. A cloud invoice may group several of these services together. Ask the platform owner which line items are available and which are shared across workloads. Attribute costs to a tenant or feature only where the data supports that split.
For a hosted model, one simple estimate begins with workload volume and average input and output size:
1monthly model cost =
2  requests per month * average input units per request * input price per unit
3  + requests per month * average output units per request * output price per unit
This is a planning model, not a bill. Use the provider's current units and rates, including any different treatment for cached input, batch work, or output types. Do not copy a price from an old slide. Record the date, currency, service region, model identifier, and pricing page used. Add other services separately, and include error retries and evaluation traffic if they consume paid resources.
For an illustrative NorthPort estimate, suppose dispatchers send 8,000 requests in a month. A planning sample suggests 1,800 input tokens and 250 output tokens per request. These are synthetic assumptions chosen only to demonstrate the arithmetic. The model would process about 14.4 million input tokens and 2 million output tokens in that month before retries, cache effects, or evaluation runs. Multiply each quantity by the relevant current rate to estimate model charges. Then add retrieval, hosting, logs, and support. No price is asserted here because provider rates and billing rules can change.
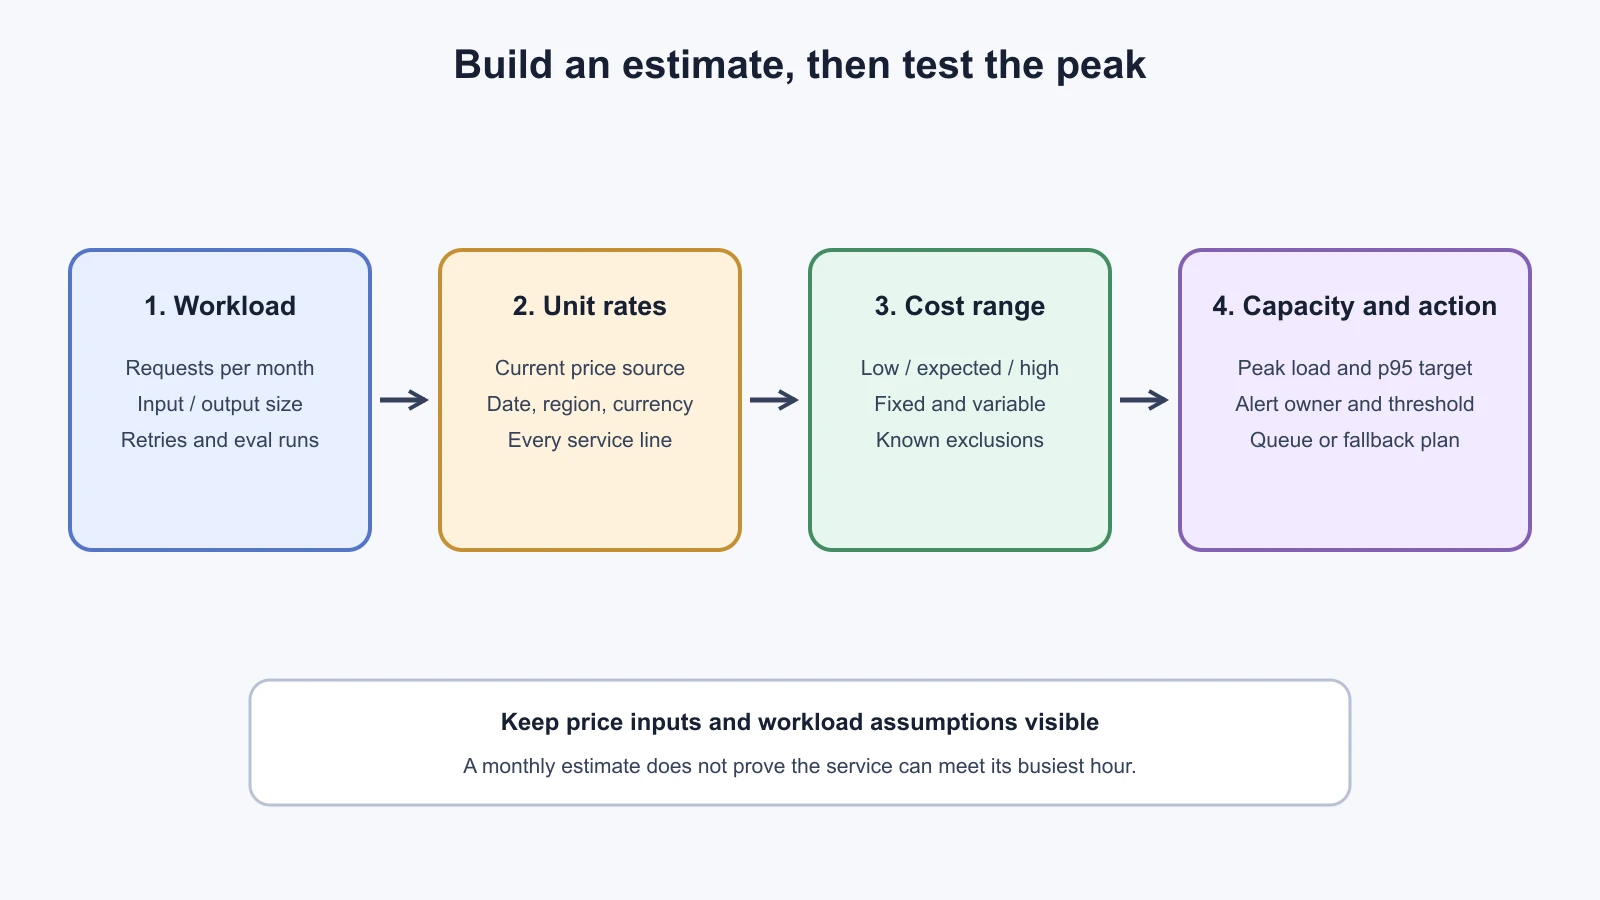
Ask how the sample was collected. If only ten prototype messages were measured, that may not represent long conversations, multiple languages, peak shift activity, or tool failures. Use a range for uncertain quantities. For example, record a low, expected, and high request volume from the customer, with the owner of each assumption. The forecast is easier to revise when its inputs are visible than when a single number is presented as a promise.
Separate average monthly usage from peak capacity. A monthly total estimates usage charges, but it does not tell the customer whether the service can handle a busy hour. Estimate requests per minute, concurrent in-flight work, input and output size at peak, and the rate limit or compute capacity for each dependency. A queue can smooth a burst for asynchronous work. It can also delay the result. If the user waits for a live answer, agree on the maximum queue delay and what happens when capacity is reached.
Choose an optimization that fits the workflow
Reduce unnecessary requests. If the system makes several sequential model calls for one user task, check whether a simpler workflow can combine steps without making the instruction unclear. Remove repeated calls that add no value. Parallelize independent work only when it is safe to run at the same time. A dependent tool call still has to wait for the result it needs.
Use a smaller model when it meets the bar. Smaller models can often respond faster and cost less per unit, but the customer cares about the complete task. Evaluate the smaller candidate on representative cases, including difficult cases, and compare the failure types. It may need different instructions or a deterministic check around its output. Keep a route to a stronger model or human review if the task and policy allow it. The lesson on choosing an AI approach covers selecting the approach before tuning its runtime.
Trim input and output with care. Remove irrelevant retrieved passages and stale conversation history. Ask for a concise answer when the user's screen calls for one. Shorter output can reduce generation time and usage, but deleting a qualification or source citation can make the answer unsafe or unusable. Preserve the fields and caveats required by the approved criteria. OpenAI's latency guide describes reducing requests and generated tokens as options; use customer-specific evaluation results to decide whether the change preserves the task.
Cache only when reuse is safe. A cache keeps a prior result or computation so the system can reuse it instead of doing the same work again. It can help when many requests share a stable prompt prefix or ask for a stable lookup. It can return stale information when a procedure changes. Define the cache key, expiration, invalidation event, and tenant boundary. Never reuse a response across customers if the content or permissions can differ. Track hit rate and the cost or time saved, then check for stale or incorrect hits. Provider prompt caching has its own rules; check its current documentation and pricing before depending on it.
Batch work that does not need an immediate response. Batching groups multiple jobs for processing together. It can improve throughput or cost for tasks such as overnight summaries, but usually trades away immediate completion. Keep live dispatch help out of a queue that may not finish during the relevant decision. OpenAI's rate-limit guidance notes that asynchronous batch processing suits work that does not require an immediate result. This is a vendor example; other providers have different features and limits.
Consider quantization only when you control the model runtime. Quantization represents model values with lower numerical precision, often to reduce memory requirements or increase inference efficiency on supported hardware. It is an awareness-level option for an FDE because implementation depends on the model, runtime, and hardware. It can affect model accuracy: NVIDIA's TensorRT documentation describes rounding and clamping errors introduced by quantization. Run the customer eval set and performance tests on the target deployment before adopting it. A memory reduction is not useful if it degrades required behavior.
Optimizations interact. Caching can reduce repeated compute but create freshness defects. Batching can improve throughput while increasing wait time. A smaller model can reduce unit cost while producing more retries or escalations. Parallel calls can shorten the critical path while increasing peak concurrency and total usage. After any change, rerun the relevant evals and measure the same latency and workload metrics against the baseline.
Estimate a range and make the assumptions inspectable
Create one row for each cost component. For every row, record the usage unit, expected volume, low and high assumptions, current rate source, monthly estimate, owner, and uncertainty. Do not bury data storage or evaluation runs in a vague "other" line if they can grow with use. For fixed infrastructure, record both its base capacity and the expected peak. If the customer cannot yet estimate an input, show it as unknown and name who can provide it.
| Component | Unit to measure | Estimate inputs | Owner or evidence |
|---|---|---|---|
| Model requests | Input and output tokens, images, or audio units | Volume, size distribution, retry rate, current rate | Provider usage export and pricing page |
| Retrieval | Embedding and reranking calls, stored vectors, search volume | Documents, update frequency, requests | Data or platform owner |
| Application hosting | Instance time, memory, or request count | Baseline and peak load, minimum replicas | Cloud billing data |
| Network | Data transfer and private connectivity | Inbound and outbound volume, region path | Network owner |
| Observability | Logs, metrics, traces, retention | Events per request, retention period | Operations owner |
| Evaluation | Test runs and human review | Run frequency, cases, reviewer time | Product and AI owners |
| Support | Investigation and operational time | Service window, escalation volume | Customer support owner |
Present a range rather than a false-precision forecast. State the request volume, token distribution, retry assumptions, pricing date, and what is excluded. If a cost depends on a minimum commitment or reserved capacity, put that beside usage charges. Separate a shared platform cost from the portion you can attribute to this feature. Ask the customer finance or platform owner to confirm the billing interpretation before using the estimate for a business case.
The customer's budget owner should define what happens at an alert threshold. A budget alert may notify someone without stopping a service. A hard limit can prevent additional usage but may also interrupt a dispatcher's workflow. Set alert thresholds with owners, notification recipients, and an operational response. For a possible overspend, decide whether to reduce nonessential evaluation runs, queue asynchronous jobs, move to an approved fallback, or stop a feature. Do not silently switch models if the change could affect quality or data handling.
Plan capacity for peaks
Capacity planning estimates whether the system can serve expected work and bursts within agreed performance limits. Begin with peak requests per minute and the size of each request, not just daily or monthly averages. Include concurrent users, long-running tasks, retries after timeouts, and background evaluation jobs. A retry storm can multiply demand during an outage, so define backoff and limits rather than retrying every failure immediately.
Identify the narrowest dependency: model request limits, retrieval throughput, database connections, network egress, or application workers. Ask what happens when it is full. Does the service return a clear busy message, queue work, switch to a manual path, or fail in a way that looks like a blank answer? A useful overload policy protects the rest of the customer's systems and tells the user what to do next.
Load tests should resemble the agreed workload and run in an approved environment. Test the expected peak and a higher stress condition selected by the platform owner. Record the workload generator, candidate version, region, dependency limits, error rate, p50 and p95 response times, and cost-related usage. Do not run a load test against customer production or a metered provider endpoint without an explicit test window and spend guardrail.
MLOps, short for machine learning operations, is the set of practices that connects model development with testing, deployment, and ongoing operation. Google's MLOps guidance describes automation and monitoring across integration, testing, release, deployment, and infrastructure management; that document primarily addresses predictive AI systems. For a customer-facing AI feature, the same operational idea is to track which model, prompt, data, and application versions are running, monitor quality and usage, and make changes through a reviewable pipeline. The particular pipeline depends on whether the feature uses a hosted model, a model you operate, or both.
Set alerts for user impact and resource use, not only CPU. Useful signals include request volume, p95 latency, timeouts, model usage by feature, retrieval failures, budget threshold status, and quality checks from the eval suite. An alert needs an owner and a response. A dashboard with no one responsible for acting on it is not an operational plan. Link each alert to a runbook or escalation path and review it after incidents.
Explain the trade-off before changing the system
Give the customer at least two viable options and describe what each changes. For example: keep the current model and reduce irrelevant retrieval context; test a smaller model on the same cases; or move non-urgent summaries into a batch job. Compare estimated cost, response-time impact, quality evidence, data boundaries, implementation effort, and rollback. The customer chooses which trade-off fits their workflow and risk tolerance.
Make the baseline reproducible. Record the workload sample, candidate versions, test dataset, test date, region, and measurement definitions. Then change one major variable at a time where possible. If the model, prompt, retrieval settings, and cache all change together, a better cost figure will not tell the team which change helped or which introduced a defect.
After deployment, compare actual use with the forecast. Review usage by feature and tenant where permitted, requests that exceed the assumed size, cache hit rate, retries, p95 latency, and spend alerts. Update the estimate as traffic grows or the customer's procedure set changes. A forecast is a working model, not a one-time promise. Escalate material differences early and agree whether to tune, budget for additional capacity, or narrow the feature's use.
Mistakes beginners make
Using a provider price as the whole cost. Model usage may be only one part of an AI feature's bill. Retrieval, storage, hosting, network, observability, evaluations, and support can contribute too.
Fix: List each component, its unit, the owner of the usage data, and any excluded cost. Date the provider rates used.
Sizing from an average request. A small mean can hide long prompts, large outputs, peak shift traffic, or retries that consume additional capacity.
Fix: Measure a representative distribution, agree a peak scenario, and report p95 latency and failure behavior under load.
Optimizing before defining quality. A smaller model, shorter response, cache, or quantized runtime may reduce cost while changing the behavior the customer needs.
Fix: Keep the agreed eval criteria fixed, compare the same cases, and record quality and latency alongside cost.
Treating budget alerts as automatic shutdown controls. A notification does not necessarily stop usage. A hard limit may interrupt a production workflow.
Fix: Agree who receives each alert and what action they take. Decide on a safe fallback before changing limits.
Recap and try it yourself
Estimate from workload units and current rates, include supporting services, and make uncertain assumptions visible. Measure user-visible latency with a definition the customer accepts, including tail behavior and errors. Peak capacity is different from a monthly usage forecast. Compare optimizations against the same quality criteria: request reduction, smaller models, caching, batching, and quantization each have workload-specific trade-offs. After release, monitor usage, latency, quality, and budget signals with named owners.
Try it yourself: using the fictional NorthPort planning sample, write down the 8,000 monthly requests, 1,800 average input tokens, and 250 average output tokens. Add one row each for hosting, retrieval, and observability, leaving prices blank until you check the current customer or provider rate source. Then ask the customer for a peak-hour request estimate and an acceptable p95 response time. Compare a smaller model and asynchronous batching as separate options. Name the eval evidence and fallback needed before either could be adopted.
For deeper guidance, see the AI Agents lesson on agent cost and latency and Prompt Engineering's prompts in production.
Sources
Checked on 5 November 2026. OpenAI's latency optimization guide supports reducing requests and output, comparing model size, and considering parallel work and user-perceived wait. Its cost optimization guide supports request and token reduction, model choice, and asynchronous batch processing; its rate-limit guide supports the distinction between batch and synchronous work. NVIDIA's TensorRT accuracy considerations supports the note that quantization can introduce rounding and clamping error. Google's MLOps architecture guidance supports the definition and pipeline discussion; it primarily covers predictive AI and was last reviewed 28 August 2024. NorthPort figures are fictional planning inputs, not measured usage or price claims.