I remember debugging a customer dashboard that was driving our support team crazy.
Users complained that after using the application for about 45 minutes, it would become incredibly slow. Buttons would lag, animations would stutter, and eventually, the browser tab would just crash with an "Aw, Snap!" error.
We restarted the servers. We optimized the database queries. Nothing helped.
The problem wasn't the server. It was the browser. Every time a user opened a new graph on the dashboard, we were creating massive arrays of data in JavaScript and—crucially—never throwing them away. We were filling up the user's RAM until their browser literally suffocated.
That was my introduction to Memory Leaks.
If you think memory management is something only C++ developers worry about, you are walking into a trap. JavaScript handles memory automatically, which makes us lazy. And when we get lazy, we leave "zombie" data behind that kills performance.
In this article, we are going to learn exactly how JavaScript manages memory, why it sometimes fails to clean up after itself, and how you can spot these leaks before your users do.
What is a Memory Leak? (The Plain English Version)
A memory leak happens when your application creates objects or variables that it no longer needs, but the JavaScript engine thinks it still needs them.
Because the engine believes this data is still important, it refuses to delete it. Over time, this useless data piles up like trash in a hallway. Eventually, there is no room left to move, and the application crashes.
The Mental Model: The Hoarder’s Garage
To understand memory management, I use the "Garage" analogy.
Imagine your computer's memory (RAM) is a garage. You can store boxes (objects) in it. JavaScript has an automatic cleaning service called the Garbage Collector (GC). The GC comes by periodically to throw away trash.
However, the GC follows a very strict rule: "I will only throw away a box if I cannot reach it."
- The Root (The Door): The GC starts at the main door (the
windowobject or global scope). - The String: Imagine every box is tied to the door with a string (a reference). If Box A holds Box B, there is a string from A to B.
- The Sweep: The GC grabs the string at the door and follows it. It touches every box connected to that string.
- The Trash: Any box that cannot be reached—any box with no string attached to the main web—is considered trash and gets incinerated.
A Memory Leak is when you have a box you don't want anymore, but you accidentally left a string tied to it. The GC sees the string, assumes you still want the box, and leaves it there forever.
Step-by-Step Code Execution
Let's look at the most common leak I see in React and Vanilla JS: The Forgotten Event Listener.
1// 1. Setup: A function to create a heavy object
2function createHeavyData() {
3  const bigArray = new Array(100000).fill("Leaky Data");
4  return bigArray;
5}
6
7// 2. The Leaking Action
8function addButtonListener() {
9  const heavyData = createHeavyData();
10
11  const button = document.getElementById('myButton');
12
13  // THE LEAK: The callback holds a reference to 'heavyData'
14  button.addEventListener('click', function() {
15    console.log(heavyData[0]);
16  });
17}
18
19// 3. User navigates around the app
20addButtonListener();
21// Imagine the user leaves this page or removes the button from the DOM...
22
What is happening here?
Line 2: createHeavyData allocates a huge chunk of memory.
Line 8: addButtonListener runs. It creates heavyData.
Line 14: We attach an event listener to a button. Crucially, the callback function (the listener) forms a Closure. It captures the heavyData variable so it can use it later.
The Problem:
Even if addButtonListener finishes running, heavyData cannot be deleted. Why?
- The
windowobject holds thedocument. - The
documentholds thebutton. - The
buttonholds theevent listener. - The
event listenerholdsheavyData(via closure).
There is an unbroken chain of strings from the Root (window) to the heavyData.
If you remove the button from the screen (e.g., changing pages in a Single Page App) but forget to remove the listener, the browser is technically still holding onto that button in memory, and that button is holding the massive array. Do this 10 times, and you run out of RAM.
How It Works Internally: Mark-and-Sweep
To be a senior developer, you need to know the algorithm JavaScript uses. It is called Mark-and-Sweep.
The Garbage Collector runs periodically (you cannot force it). When it runs, it performs these steps:
- Mark (The Reachability Test): It starts at the "Roots" (Global Object, currently executing function context). It traverses every reference. "Global has an object A. Object A has a property pointing to Object B." It marks every object it visits as "Active."
- Sweep (The Cleanup): It looks at the memory heap. Any object that was not marked is effectively unreachable. It is "garbage." The GC frees up that memory space to be used again.
The Leak: A memory leak is simply an object that should be dead (unreachable) but is unintentionally kept alive by a reference from a Root.
Common Mistakes Developers Make
I have reviewed thousands of lines of code. These are the top 4 leaks I see.
1. Accidental Global Variables
This usually happens in non-strict mode or with careless typing.
1function saveData() {
2  // Oops! Forgot 'const', 'let', or 'var'
3  data = "I am now a global variable";
4}
5
Because data has no keyword, JavaScript attaches it to window.data. The window never dies until you close the tab. Therefore, this data never dies.
The Fix: Always use strict mode ('use strict') or a linter (ESLint).
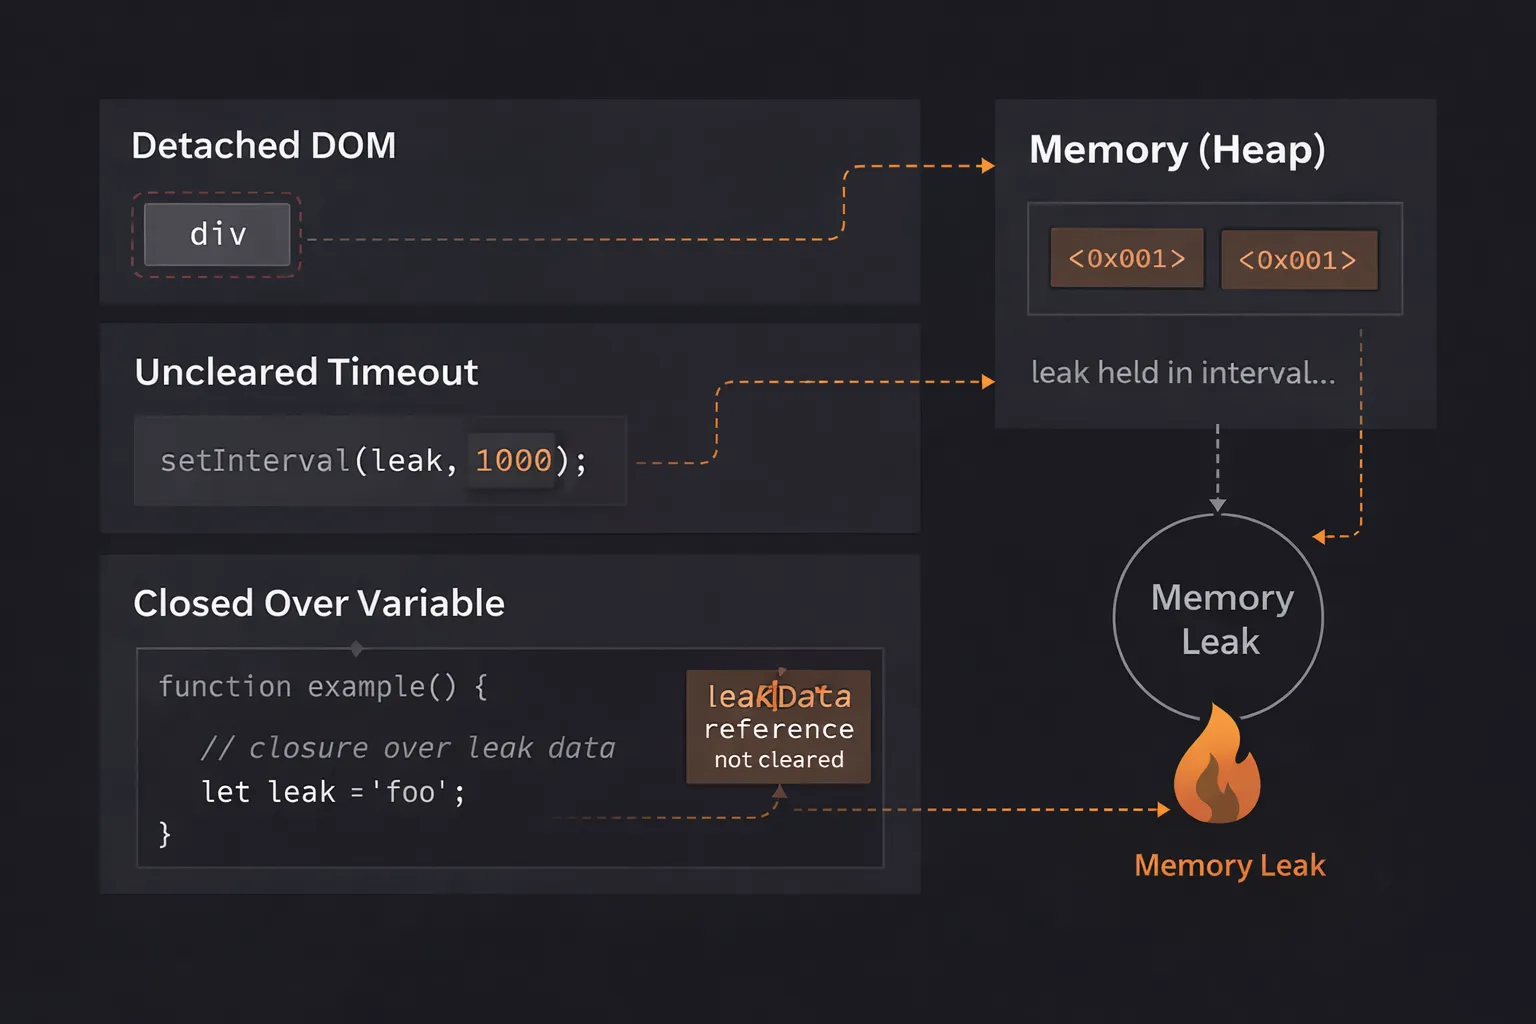
2. The Forgotten Interval
This is a classic in dashboard apps.
1function startTimer() {
2  const hugeObject = { ... };
3
4  setInterval(() => {
5    // This runs every second forever
6    console.log(hugeObject);
7  }, 1000);
8}
9
You navigate away from the dashboard. The component unmounts. But setInterval belongs to the window. It keeps running. It keeps referencing hugeObject. The memory never clears.
The Fix: Always assign the interval to a variable and clear it when the component unmounts.
1const id = setInterval(...)
2clearInterval(id); // Run this on cleanup
3
3. Detached DOM Nodes
This is tricky. It happens when you store a reference to a DOM element in JavaScript, but then remove that element from the page.
1let savedButton;
2
3function removeButton() {
4  const btn = document.getElementById('submit');
5  document.body.removeChild(btn); // Removed from screen
6
7  savedButton = btn; // Still referenced in JS!
8}
9
The button is gone from the screen. But because savedButton still points to it, the entire button object stays in memory.
Worse, if that button is inside a huge <div> tree, the browser might keep the entire tree in memory just to preserve that one button's context.
4. Closures (The Silent Killer)
We love closures. But they hold onto their outer scope variables.
1function outer() {
2  const bigData = new Array(1000000);
3
4  return function inner() {
5    // Even if I don't use bigData here,
6    // some engines might keep it if it shares scope with other closures.
7    console.log("Hi");
8  }
9}
10
If you store the inner function somewhere long-term, bigData might stay in memory attached to it.
Real-World Use Cases
Where does this actually hurt you?
1. Single Page Applications (SPAs)
In React, Vue, or Angular, you don't reload the page when you navigate. You just swap components.
If Component A creates a listener or a subscription and you navigate to Component B without cleaning up A, the leak stays.
After clicking through 50 pages, the browser becomes sluggish. This is why "Cleanup Functions" in useEffect (React) are mandatory, not optional.
2. Data Visualization Libraries
Libraries like D3.js or Chart.js create complex DOM structures and bind many event listeners.
If you simply delete the <div> holding the chart without calling the library's .destroy() method, the library often leaves internal references to that data alive. I have seen dashboards leak 500MB of RAM just by toggling charts on and off.
Interview Perspective
If I am interviewing you for a Senior role, I will ask: "How do you debug a memory leak?"
I don't want a theoretical answer. I want to hear about Chrome DevTools.
The Heap Snapshot Strategy
Here is the correct answer:
- "I would open Chrome DevTools and go to the Memory tab."
- "I would take a Heap Snapshot to see the baseline memory usage."
- "I would perform the action I suspect is leaking (e.g., open and close a modal 10 times)."
- "I would force a Garbage Collection (clicking the trash icon)."
- "I would take a second Heap Snapshot."
- "I would compare Snapshot 2 vs Snapshot 1. If the memory usage increased and didn't go back down, I look for objects that should have been deleted (like 'ModalComponent')."
TL;DR / Key Takeaways
- Memory Leaks happen when you maintain a reference to data you no longer need.
- The Garbage Collector only deletes objects it cannot reach from the Root.
- Event Listeners and Intervals are the most common causes.
- Detached DOM elements can keep huge trees of HTML in memory invisibly.
- Debug using Chrome's Heap Snapshot tool, not just by staring at the code.
FAQ
Q: Does reloading the page fix memory leaks? A: Yes! Reloading the page clears the JavaScript heap entirely and starts fresh. This is why leaks are often ignored in short-lived websites but are fatal in long-running web apps (like Gmail or Spotify).
Q: Are closures memory leaks? A: Not inherently. Closures are a feature. They only become leaks if you hold onto the closure function longer than necessary, forcing the engine to keep the attached variables alive.
Q: Can const and let prevent leaks?
A: They help prevent accidental global variables (Mistake #1), but they do not prevent listener or interval leaks. You still need to manage your cleanup logic.
Conclusion
Memory management in JavaScript is automatic, but it isn't magic. It relies on you playing by the rules.
The rule is simple: If you open it, close it. If you start a timer, stop it. If you add a listener, remove it. If you create a connection, disconnect it.
The next time you write a useEffect or an addEventListener, pause. Ask yourself: "When does this die?" If you can't answer that question, you are writing a memory leak.
Now, go open your application, take a Heap Snapshot, and see what ghosts are living in your RAM. You might be surprised.