I once worked on a Single Page Application (SPA) that was, for lack of a better word, a time bomb.
It worked perfectly for the first ten minutes. It was fast, snappy, and responsive. But if you left it open for an hour—perhaps to go to lunch—you would come back to a sluggish nightmare. Animations stuttered. Clicking a button took a full second to register. Eventually, the browser tab would just crash with the dreaded "Aw, Snap!" error message.
We checked the network tab. It was fine. We optimized our React renders. No change.
The culprit was invisible. It was memory. We were creating thousands of objects, arrays, and event listeners, and we were never cleaning them up. We were relying on JavaScript to take out the trash for us, but we were unknowingly locking the trash can shut.
This is the reality of Garbage Collection (GC). In languages like C or C++, you have to manually allocate and free memory. It’s hard work, but you have total control. In JavaScript, the engine does it for you automatically. This makes coding easier, but it also makes us lazy. We assume the engine always knows what it’s doing.
Spoiler alert: It doesn't always know.
In this article, we are going to look under the hood of the JavaScript engine. We will explore how memory is allocated, how the Garbage Collector decides what to delete, and crucially, how you might be accidentally preventing it from doing its job.
What is Garbage Collection? (The Plain English Version)
Garbage Collection is the automatic process of freeing up memory that your program is no longer using.
Think of your computer's memory (RAM) like a limited bucket of space. Every time you create a variable, function, or object, you take a scoop of space out of that bucket. If you keep taking scoops without putting any back, the bucket eventually runs empty, and your program crashes. Garbage Collection is the background janitor that looks for data you aren't using anymore and throws it away, returning that space to the bucket so you can use it again.
The Mental Model: The Reachability Test
To visualize how the Garbage Collector makes decisions, I use the "Floating Island" analogy.
Imagine your application’s memory is a vast ocean.
- The Roots (The Main Island): There is one main island that is always safe. In the browser, this is the
windowobject (the Global Scope). It can never sink. - The Objects (Floating Platforms): Every object or variable you create is a floating platform in the ocean.
- The References (Ropes): When you assign an object to a variable (e.g.,
let user = { name: "Alice" }), you are tying a rope from the Main Island to that platform. If object A references object B, there is a rope from A to B.
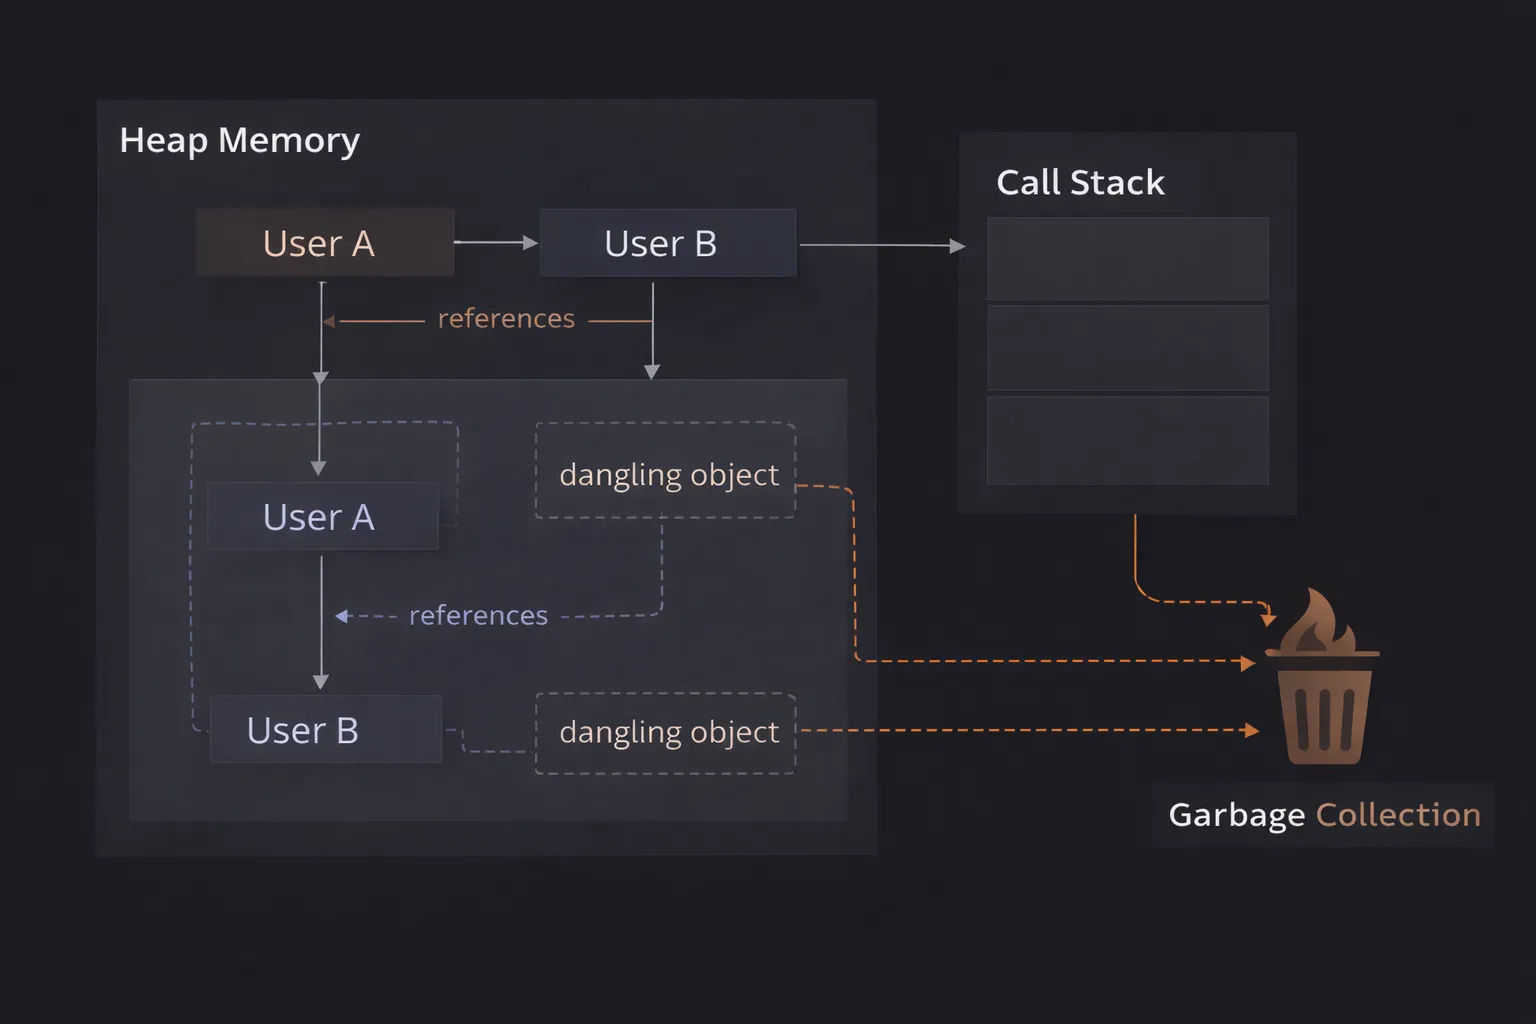
The Golden Rule: The Garbage Collector flies over the ocean. It looks at every platform. If a platform is connected to the Main Island by a series of ropes (references), it is safe. It stays.
However, if a platform has no ropes connecting it to the Main Island—if it has drifted away and is unreachable—the Garbage Collector sinks it. It destroys it and reclaims the space.
This concept is called Reachability. It doesn't matter if the object is "useful" to you. It only matters if the code can reach it from the Root.
Step-by-Step Code Execution
Let's look at a simple code example and trace exactly when memory is allocated and freed.
1function processData() {
2  // Step 1: Allocation
3  let user = {
4    name: "John",
5    age: 30
6  };
7
8  let address = {
9    city: "New York"
10  };
11
12  // Step 2: Linking
13  user.location = address;
14
15  // Step 3: Reassignment
16  user = null;
17
18  return true;
19}
20
21processData();
22
What is happening here?
Step 1: Allocation
When processData runs, the engine allocates memory in the Heap for two objects: { name: "John"... } and { city: "New York" }.
The variable user holds a reference (a rope) to the John object.
The variable address holds a reference to the New York object.
Step 2: Linking
We write user.location = address. Now, the John object has a rope connecting it to the New York object.
Notice that the New York object now has two ropes attached to it: one from the variable address, and one from the property user.location.
Step 3: Reassignment
We write user = null.
We effectively cut the rope between the variable user and the John object.
Is the John object garbage?
Yes. There are no other ropes connected to it. You cannot reach "John" anymore from the code. The Garbage Collector sees this and marks it for deletion.
The Tricky Part:
What about the "New York" object?
Even though "John" is garbage, "New York" still has a rope from the variable address. So "New York" survives.
Step 4: Function Exit
The function processData finishes. The local variable address goes out of scope. That rope is cut.
Now, the "New York" object has lost its last rope. It is now unreachable. The Garbage Collector marks it for deletion too.
How It Works Internally: Mark-and-Sweep
Now, let's get technical. How does the engine actually implement this "rope checking"? It uses an algorithm called Mark-and-Sweep.
In the early days of programming, we used a simpler method called "Reference Counting" (tracking how many things point to an object). But that had a major flaw: Circular References. If Object A pointed to B, and B pointed to A, they always had 1 reference each, so they never got deleted, even if nobody else needed them.
Modern JavaScript engines (like V8 in Chrome) use Mark-and-Sweep to solve this.
The 3 Phases of Mark-and-Sweep
The GC runs periodically (you cannot force it to run). When it wakes up, it does this:
- Mark (The Inspection): The GC starts at the Roots (Global object and current execution context). It travels down every reference it can find. "I can see Object A. From Object A, I can see Object B." It marks every object it visits as "Reachable" (or "Alive").
- Sweep (The Cleanup): The GC scans the entire memory heap. It looks for any memory blocks that were not marked in the previous step. Since they weren't marked, it means the Root couldn't reach them. They are garbage. It deletes them and reclaims the memory.
- Compact (The Optimization): Imagine your memory is a slice of Swiss cheese—full of holes where objects used to be. This is inefficient. So, the engine moves the surviving objects closer together to fill the gaps. This makes allocating new memory faster in the future.
Generational Collection
Engines like V8 are even smarter. They split memory into two zones: the Nursery (Young Generation) and the Old Generation.
- Nursery: Where new objects are born. Most objects die young (like variables inside a function). The GC cleans this area very frequently and very quickly.
- Old Generation: If an object survives multiple cleaning cycles in the Nursery, it gets promoted to the Old Generation. The GC checks this area less often because scanning it takes more processing power.
This optimization ensures that your web app doesn't stutter constantly while the GC checks long-lived data.
Common Mistakes Developers Make
I have spent countless hours debugging memory leaks caused by these three patterns.
1. Accidental Global Variables
This is the easiest mistake to make, especially if you aren't using strict mode ('use strict').
1function login() {
2  // Oops! Missing 'let', 'const', or 'var'
3  currentUser = { name: "Alex", id: 12345 };
4}
5login();
6
The Bug: Because you didn't declare the variable, JavaScript attaches currentUser to the window (Global) object.
The Consequence: The Global Object never dies. Therefore, currentUser never dies. It stays in RAM until the user refreshes the page.
2. The Forgotten Interval
I see this in React components all the time.
1function startTracker() {
2  const heavyData = new Array(10000).fill("Data");
3
4  setInterval(() => {
5    // We are referencing heavyData here!
6    console.log(heavyData[0]);
7  }, 1000);
8}
9
The Bug: You might think heavyData will be garbage collected when startTracker finishes. It won't.
The Consequence: The setInterval callback forms a Closure. It captures heavyData to keep it alive. Since setInterval runs forever (until you stop it), heavyData lives forever. Even if you navigate to a different page in your Single Page App, if you didn't call clearInterval, this massive array sits in memory, leaking 10MB of RAM every time you navigate back and forth.
3. Detached DOM Nodes
This one is subtle. It happens when you keep a JavaScript reference to a DOM element that you have removed from the page.
1let detachedNodes = [];
2
3function create() {
4  const ul = document.createElement('ul');
5  for (let i = 0; i < 100; i++) {
6    const li = document.createElement('li');
7    ul.appendChild(li);
8  }
9
10  // We remove it from the body...
11  document.body.removeChild(ul);
12
13  // BUT we keep a reference here!
14  detachedNodes.push(ul);
15}
16
The Bug: The <ul> is no longer on the screen. You might think the browser deletes it.
The Consequence: Because detachedNodes (a JS array) still points to the ul, the GC cannot touch it. Worse, because the ul holds references to its 100 children li elements, the entire tree stays in memory.
Real-World Use Cases
Why does this matter if computers have 16GB of RAM?
1. Infinite Scroll Feeds
Imagine building a social media feed like Twitter or Instagram. As the user scrolls down, you load more posts.
If you simply append new <div> elements forever without removing the old ones (Virtualization), the DOM grows massive. The browser uses more RAM to store the nodes. The GC works harder to scan them. Eventually, the scroll performance drops from 60fps to 10fps, and the phone gets hot.
2. WebSocket Connections
In chat apps, you open a WebSocket connection. If a user logs out or switches chats, and you forget to .close() the socket object, the connection stays open. The server keeps sending data. The browser keeps buffering it. This is a classic "silent leak" that crashes the tab after a few hours.
3. Caching Strategies
Developers often write custom caching logic.
1const cache = {};
2function getData(key) {
3  if (cache[key]) return cache[key];
4  // fetch and store...
5}
6
If you never clean this cache, it grows indefinitely. This is called an Unbounded Cache.
The Fix: Use a WeakMap or implementing an LRU (Least Recently Used) strategy to delete old keys.
Interview Perspective
If I am interviewing you for a Senior Frontend role, I will ask about GC. I am checking if you understand the cost of the code you write.
Common Question: "What is a Memory Leak?"
Good Answer: "A memory leak is memory that is no longer required by the application but, for some reason, is not returned to the operating system or the pool of free memory. In JavaScript, this usually happens when unwanted objects are still referenced by the root."
The Tricky Question: "What is a WeakMap and how does it help GC?"
The Answer: This is the gold standard question.
"A WeakMap is a special collection where the keys are weakly referenced. If the key object is deleted elsewhere in the app, the WeakMap does not prevent the Garbage Collector from deleting it. In a normal Map, the key would stay alive just because it's in the Map. WeakMap is perfect for caching extra data about DOM nodes without causing memory leaks."
TL;DR / Key Takeaways
- Automatic but not Magic: JavaScript cleans up memory for you, but only if you cut the ropes (references).
- Reachability: If the Root can reach an object, it stays. If not, it goes.
- Mark-and-Sweep: The engine periodically scans, marks active objects, and sweeps away the rest.
- Closures are Dangerous: They hold onto memory. Use them wisely.
- Clean Up: Always clear intervals, remove event listeners, and nullify global references when you are done.
FAQ
Q: Can I force Garbage Collection to run? A: No. You cannot trigger it manually in standard JavaScript. It is entirely up to the engine's heuristics (e.g., when memory usage hits a certain threshold). However, in Chrome DevTools (Performance tab), there is a trash can icon to force a GC for debugging purposes.
Q: Does reloading the page fix memory leaks? A: Yes! Reloading the page wipes the entire JavaScript Heap and starts fresh. This is why memory leaks are often ignored in short-session websites but are critical in long-running web apps.
Q: How do I know if I have a leak? A: Use the Chrome Task Manager. Open it (Shift+Esc) and watch the "Memory Footprint" column. If you click around your app and the number keeps going up but never comes down, you have a leak.
Conclusion
Garbage Collection is one of the most sophisticated parts of the JavaScript engine, but it relies on a partnership with you, the developer.
The engine promises to clean up the mess, but only if you signal that you are done with it. When you leave dangling references, forgotten timers, or attached event listeners, you are breaking that partnership.
The next time you write addEventListener, pause for a second. Ask yourself: "When does this listener die?" If you can't answer that question, you are planting a time bomb in your application.
Now, go check your useEffect cleanup functions. I bet there is a missing clearInterval waiting for you.