The recent GitHub outage events have sparked significant discussion among engineering teams, but the data tells a more nuanced story than simple downtime. In its latest availability report, the GitHub Blog detailed eight specific incidents in October 2026 that resulted in degraded performance across its services. While the report itself provides limited public detail on the specific causes of these events, these incidents serve as a valuable prompt to examine common failure patterns, understand typical root causes, and implement concrete steps to improve system resilience and incident management processes in any organization.
Understanding the Scope of the October 2026 GitHub Outage
When a platform as critical as GitHub experiences degradation, the impact ripples through the entire software development lifecycle. According to the GitHub Blog, the company experienced eight distinct incidents during October 2026. It's crucial to distinguish between a total outage, where services are completely unavailable, and degraded performance, where services remain accessible but slower or less reliable. The GitHub report, by focusing on degraded performance, highlights that even partial disruptions can severely impact developer workflows, from code pushes to CI/CD pipeline executions.
The significance of eight incidents in a single month, even if they are degradations rather than full outages, lies in their frequency. This pattern suggests a series of smaller, compounding issues that test the robustness of infrastructure. For developers and operations teams, the takeaway from such a scenario isn't just about what might have broken, but why similar issues commonly arise and how effective recovery is handled. Repeated, moderate-severity incidents often point to underlying architectural weaknesses or monitoring gaps that, if left unaddressed, can escalate into major outages.
Common Root Causes in System Degradation
While the GitHub availability report for October 2026 does not publicly detail the specific technical root causes of each incident, we can draw on common patterns observed in complex distributed systems. When platforms experience degraded performance, several recurring themes often emerge. Understanding these common root causes is the first step toward prevention and building more resilient systems.
Infrastructure Saturation and Scaling Limits
A common driver of degraded performance in large-scale systems is related to infrastructure capacity. As demand for services like code hosting, package registries, and CI/CD actions fluctuates, specific components can hit scaling limits. This doesn't always mean the entire system is down; rather, certain shards or regions can become bottlenecks. For instance, if a specific database cluster reaches its connection limit, write operations may queue up, leading to latency spikes for users in that region. This type of degradation is often subtle, making it harder to detect immediately than a hard crash, but its impact on user experience can be significant.
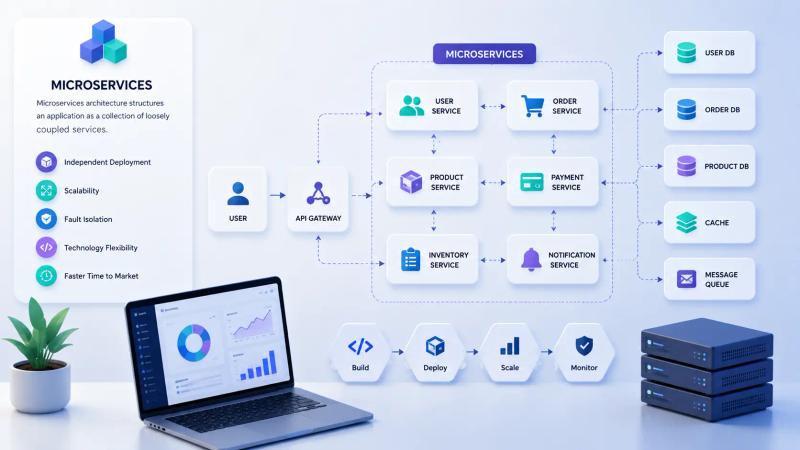
Cascading Failures in Microservices
Modern platforms often rely on thousands of interconnected microservices. In such architectures, when one service fails or slows down, it can cascade to dependent services. This is a classic microservices challenge: ensuring isolation of failure. If Service A depends on Service B, and Service B becomes slow, Service A might consume all its resources waiting for a response, effectively taking down Service A as well. This chain reaction can quickly spread across the system, turning a localized issue into a widespread degradation.
Configuration and Change Management Errors
Even in mature organizations, changes in configuration or deployment are a frequent source of instability. Bad deployments or configuration drifts can introduce subtle bugs or performance bottlenecks. These issues often arise when changes don't fully account for edge cases in traffic patterns or resource utilization. This highlights the critical importance of rigorous change management, including automated testing, peer review, and phased rollouts like canary deployments, where new changes are applied to a small subset of traffic before being rolled out globally.
Analyzing the Timeline and Response
While the GitHub availability report does not publicly detail the specific timeline or response actions for each of its October 2026 incidents, we can infer the general principles of effective incident management that any robust operations team would follow. Analyzing the typical phases of detection, mitigation, and resolution provides valuable insight into how to handle system degradation.
Detection and Alerting
A critical factor in minimizing incident impact is the speed of detection. In well-managed systems, automated monitoring systems are designed to identify degradation before widespread user reports come in. This requires a robust alerting system that tracks key performance indicators (KPIs) such as latency, error rates, and resource saturation. For any team, this means ensuring that monitoring covers not just basic uptime, but also granular performance metrics that can indicate degradation long before it escalates into a full outage.
Mitigation Strategies
Effective mitigation strategies typically involve a combination of traffic rerouting, scaling up resources, and rolling back problematic changes. The speed and effectiveness of these strategies are paramount. Automated scaling can help absorb sudden load spikes, while automated rollbacks can quickly revert a bad deployment. However, manual intervention is often still required for complex or novel issues. This underscores the importance of having pre-defined runbooks for common failure scenarios, enabling engineers to act quickly and decisively without having to diagnose the issue from scratch during a high-pressure situation.
Resolution and Post-Mortems
After any incident, a crucial step for continuous improvement is conducting a thorough post-mortem to identify the root cause and implement preventive measures. These reviews are not about assigning blame but about learning from the incident and making the system more resilient. For instance, if an incident was found to be caused by a configuration error, the post-mortem should lead to the implementation of automated configuration validation or improved deployment processes to prevent similar errors in the future.
Actionable Takeaways for Developers and Ops Teams
The GitHub October 2026 availability report, by highlighting the reality of degraded performance incidents, offers several practical lessons that any team can apply to their own infrastructure and processes to build greater resilience.
Implement Multi-Layered Monitoring
Don’t rely solely on uptime checks. Implement multi-layered monitoring that includes infrastructure metrics (CPU, memory, disk I/O), application metrics (response time, error rate), and business metrics (transaction volume, user sign-ups). This ensures that you can detect degradation early, before it impacts users. Use tools like Prometheus, Grafana, or Datadog to visualize these metrics and set up alerts based on thresholds that indicate potential issues.
Design for Graceful Degradation
Your system should be designed to degrade gracefully under load. This means that when a non-critical component fails, the core functionality should remain available. For example, if the recommendation engine slows down, the main search functionality should still work. Use circuit breakers to prevent cascading failures and implement fallback mechanisms that allow your system to continue operating in a reduced capacity rather than failing completely.
Automate Incident Response
Manual incident response is slow and error-prone. Automate as much of the response process as possible. This includes auto-scaling, automatic failover to backup systems, and automated rollbacks of bad deployments. Tools like Kubernetes, Terraform, and Ansible can help you automate these processes. The goal is to reduce the time from detection to mitigation, minimizing the impact on users.
Conduct Regular Chaos Engineering Exercises
Chaos engineering involves intentionally injecting failures into your system to test its resilience. By simulating scenarios like network partitions, database failures, or high load, you can identify weaknesses before they become real outages. Tools like Chaos Monkey or Gremlin can help you run these experiments. The key is to start small and gradually increase the scope of the experiments as your system becomes more resilient.
Improving Incident Management Processes
Effective incident management is crucial for minimizing the impact of outages and learning from them.
Define Clear Roles and Responsibilities
During an incident, having clear roles and responsibilities is essential. Assign a commander who coordinates the response, a scribe who documents the incident, and engineers who work on mitigation. This prevents confusion and ensures that everyone is focused on their specific task. Use communication tools like Slack or PagerDuty to coordinate the response and keep stakeholders informed.
Create and Maintain Runbooks
Runbooks are step-by-step guides for handling specific types of incidents. They should be created based on past incidents and updated regularly to reflect changes in your infrastructure. Runbooks should include common troubleshooting steps, mitigation strategies, and escalation paths. By having runbooks ready, you can reduce the time it takes to resolve incidents and improve the consistency of your response.
Hold Blameless Post-Mortems
After every incident, hold a blameless post-mortem to identify the root cause and implement preventive measures. The goal is to learn from the incident, not to assign blame. Encourage open and honest discussion, and focus on systemic issues rather than individual mistakes. Document the findings and track the action items to ensure that the lessons learned are implemented.
Key Takeaways
- Degradation is as important as downtime: Monitor for performance issues, not just availability, to catch problems early.
- Cascading failures are a major risk: Use circuit breakers and graceful degradation to isolate failures and maintain core functionality.
- Automation is key: Automate scaling, failover, and rollbacks to reduce response time and human error.
- Runbooks and post-mortems drive improvement: Document your response processes and learn from every incident to make your system more resilient.
FAQ
What does "degraded performance" mean in the context of a GitHub outage? Degraded performance means that GitHub services are still accessible but are slower, less reliable, or have reduced functionality compared to normal operations. This can include increased latency, intermittent errors, or limited access to certain features.
How can I prevent cascading failures in my microservices architecture? Use circuit breakers to stop sending requests to failing services, implement timeouts to prevent resource exhaustion, and design your services to have fallback mechanisms for non-critical dependencies. Additionally, ensure that your services are loosely coupled to minimize the impact of a single failure.
What is the purpose of a blameless post-mortem? A blameless post-mortem is a review of an incident focused on identifying the root cause and systemic issues rather than assigning individual blame. The goal is to learn from the incident and implement changes to prevent similar issues in the future, fostering a culture of continuous improvement.
How often should I update my incident response runbooks? Runbooks should be updated after every incident, even if no changes were made, to ensure they remain accurate. Additionally, review and update them regularly as your infrastructure and processes evolve. This ensures that your team has the most current and relevant information during an incident.
About the Author

Suraj Kumar is a writer, entrepreneur, and the CEO and founder of this website, sharing simple and practical insights on business, creativity, and personal growth. With experience building digital projects, they enjoy helping others learn, grow, and succeed online.